A
Seller's Agent in 2025
Andrea Clark
Premier Property Management
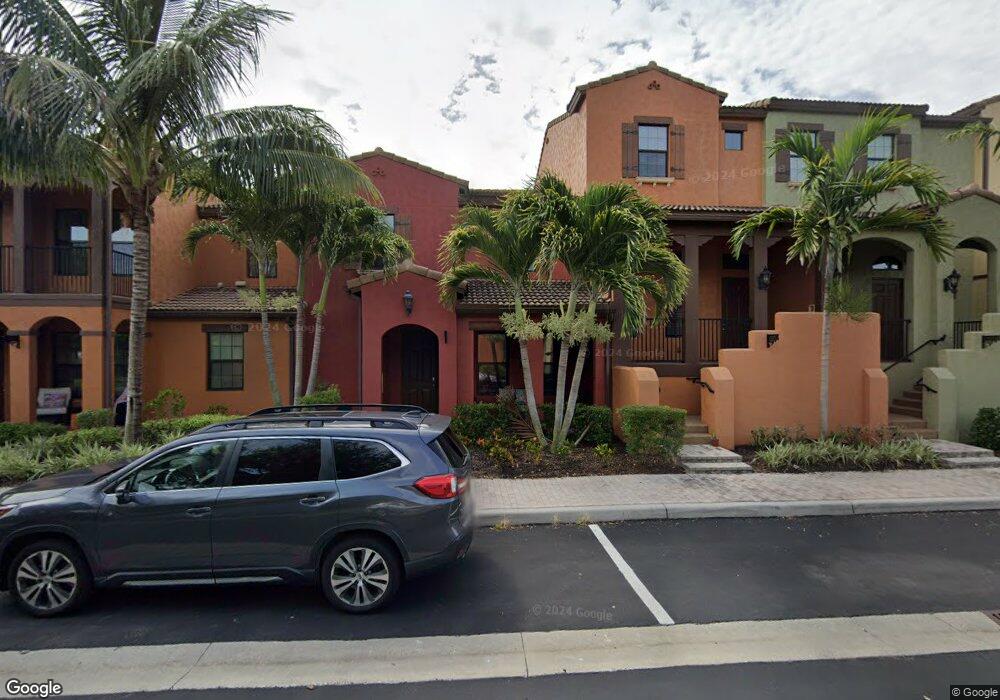
Luxurious San Benito Floorplan Sprawling Across Over 1,500 Sq. Ft in the Lely Resort! This luxury two bedroom townhouse sprawls across over 1,500 Sq. Ft and is the perfect location for your next Naples vacation! Lely is equipped with two top of the line public golf courses. This property is located in a quad with a free-form pool and BBQ right outside. The Village center amenities include a resort style swimming pool with waterfall, tot pool and playhouse, spa, sand volleyball, bocce, basketball court and a state of the art exercise fitness center, movie theater, Pub, Bistro, ice cream parlor, library and business center. Ole at Lely is a resort community close to restaurants, shopping, boating, beaches and so much more. 30 day minimum, sorry pets are not allowed.
| Date | Buyer | Sale Price | Title Company |
|---|---|---|---|
| Sullivan Gerard O | $289,990 | Noble Title & Trust Llc | |
| Osullivan Gerard | $290,000 | -- |
| Date | Event | Price | List to Sale | Price per Sq Ft | Prior Sale |
|---|---|---|---|---|---|
| 05/21/2025 05/21/25 | Rented | -- | -- | -- | |
| 09/22/2024 09/22/24 | Price Changed | $5,500 | +11.1% | $4 / Sq Ft | |
| 08/23/2024 08/23/24 | Price Changed | $4,950 | -10.0% | $3 / Sq Ft | |
| 07/16/2024 07/16/24 | For Rent | $5,500 | 0.0% | -- | |
| 07/16/2024 07/16/24 | Rented | -- | -- | -- | |
| 08/16/2023 08/16/23 | For Rent | $5,500 | 0.0% | -- | |
| 04/19/2022 04/19/22 | Sold | $384,900 | 0.0% | $256 / Sq Ft | View Prior Sale |
| 12/11/2021 12/11/21 | Pending | -- | -- | -- | |
| 12/10/2021 12/10/21 | For Sale | $384,900 | -- | $256 / Sq Ft |
| Year | Tax Paid | Tax Assessment Tax Assessment Total Assessment is a certain percentage of the fair market value that is determined by local assessors to be the total taxable value of land and additions on the property. | Land | Improvement |
|---|---|---|---|---|
| 2025 | $4,203 | $330,023 | -- | $330,023 |
| 2024 | $4,436 | $330,023 | -- | $330,023 |
| 2023 | $4,436 | $344,939 | $0 | $344,939 |
| 2022 | $3,737 | $237,637 | $0 | $0 |
| 2021 | $3,283 | $216,034 | $0 | $216,034 |
| 2020 | $3,139 | $207,076 | $0 | $207,076 |
| 2019 | $3,156 | $207,076 | $0 | $207,076 |
| 2018 | $3,491 | $236,936 | $0 | $236,936 |
| 2017 | $3,424 | $234,401 | $0 | $234,401 |
| 2016 | $3,339 | $234,401 | $0 | $0 |
| 2015 | $3,082 | $209,000 | $0 | $0 |
| 2014 | $940 | $24,800 | $0 | $0 |
A
Seller's Agent in 2025
Andrea Clark
Premier Property Management

Seller's Agent in 2022
Debi Giardello
Premiere Plus Realty Company
(239) 877-3469
2 in this area
10 Total Sales
A
Buyer's Agent in 2022
Aileen Kennedy
Ruby Realty & Referral Co Inc