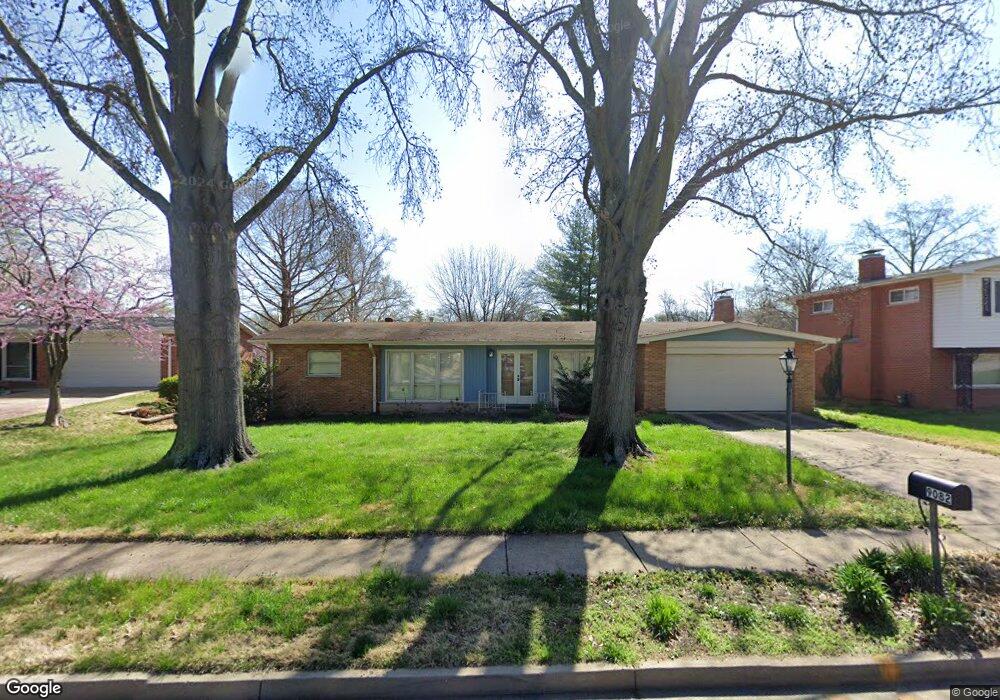
9082 Crest Oak Ln Saint Louis, MO 63126
Estimated Value: $360,776 - $444,000
3
Beds
3
Baths
1,603
Sq Ft
$254/Sq Ft
Est. Value
About This Home
This home is located at 9082 Crest Oak Ln, Saint Louis, MO 63126 and is currently estimated at $406,444, approximately $253 per square foot. 9082 Crest Oak Ln is a home located in St. Louis County with nearby schools including Long Elementary, Truman Middle School, and Lindbergh High School.
Ownership History
Date
Name
Owned For
Owner Type
Purchase Details
Closed on
Jan 19, 2001
Sold by
Denning Henry U & Norena M Trs
Bought by
Tennant James W and Tennant Maria T
Current Estimated Value
Home Financials for this Owner
Home Financials are based on the most recent Mortgage that was taken out on this home.
Original Mortgage
$163,800
Outstanding Balance
$59,954
Interest Rate
7.43%
Estimated Equity
$346,490
Purchase Details
Closed on
Dec 29, 2000
Sold by
Monarch Chesterfield Levee District
Bought by
The Chesterfield Development Llc
Home Financials for this Owner
Home Financials are based on the most recent Mortgage that was taken out on this home.
Original Mortgage
$163,800
Outstanding Balance
$59,954
Interest Rate
7.43%
Estimated Equity
$346,490
Purchase Details
Closed on
Mar 17, 2000
Sold by
Champion Stephen Warren and Champion Jacqueline L
Bought by
Champion Jacqueline L
Create a Home Valuation Report for This Property
The Home Valuation Report is an in-depth analysis detailing your home's value as well as a comparison with similar homes in the area
Home Values in the Area
Average Home Value in this Area
Purchase History
| Date | Buyer | Sale Price | Title Company |
|---|---|---|---|
| Tennant James W | $172,500 | -- | |
| Tennant James W | $172,500 | -- | |
| The Chesterfield Development Llc | -- | -- | |
| Champion Jacqueline L | -- | -- |
Source: Public Records
Mortgage History
| Date | Status | Borrower | Loan Amount |
|---|---|---|---|
| Open | Tennant James W | $163,800 | |
| Closed | Tennant James W | $163,800 |
Source: Public Records
Tax History Compared to Growth
Tax History
| Year | Tax Paid | Tax Assessment Tax Assessment Total Assessment is a certain percentage of the fair market value that is determined by local assessors to be the total taxable value of land and additions on the property. | Land | Improvement |
|---|---|---|---|---|
| 2025 | $3,403 | $57,700 | $21,580 | $36,120 |
| 2024 | $3,403 | $48,930 | $16,190 | $32,740 |
| 2023 | $3,145 | $48,930 | $16,190 | $32,740 |
| 2022 | $3,236 | $44,860 | $17,970 | $26,890 |
| 2021 | $2,949 | $48,120 | $17,970 | $30,150 |
| 2020 | $2,789 | $40,890 | $16,190 | $24,700 |
| 2019 | $2,781 | $40,890 | $16,190 | $24,700 |
| 2018 | $2,826 | $37,660 | $9,880 | $27,780 |
| 2017 | $2,795 | $37,660 | $9,880 | $27,780 |
| 2016 | $2,461 | $33,550 | $10,790 | $22,760 |
| 2015 | $2,475 | $33,550 | $10,790 | $22,760 |
| 2014 | $2,321 | $31,110 | $10,340 | $20,770 |
Source: Public Records
Map
Nearby Homes
- 9856 Amberley Dr
- 8948 Crest Oak Ln
- 12110 Trentmore Place
- 8867 Red Oak Dr
- 8737 Villa Crest Dr
- 4328 S Lindbergh Blvd
- 3906 Courtyard Place Dr
- 10225 E Watson Rd
- 9448 Parklind Dr
- 9610 Carrimae Ct
- 9535 Arban Dr
- 9209 Bent Pine Ct Unit H
- 9241 Queenston Dr
- 1412 Windward Ridge Dr
- 228 Deane Ct
- 9608 Greenview Dr
- 9405 Vandervoort Ct
- 405 Rayburn Ave
- 401 Rayburn Ave
- 21 Black Oak Dr
- 9078 Crest Oak Ln
- 9088 Crest Oak Ln
- 9061 Maple Grove Dr
- 9055 Maple Grove Dr
- 9067 Maple Grove Dr
- 9092 Crest Oak Ln
- 9072 Crest Oak Ln
- 9083 Crest Oak Ln
- 9079 Crest Oak Ln
- 9049 Maple Grove Dr
- 9073 Maple Grove Dr
- 9073 Crest Oak Ln
- 9093 Crest Oak Ln
- 9068 Crest Oak Ln
- 11815 Eddie and Park Rd
- 9035 Maple Grove Dr
- 11801 Eddie and Park Rd
- 9060 Maple Grove Dr
- 9054 Maple Grove Dr
- 9069 Crest Oak Ln