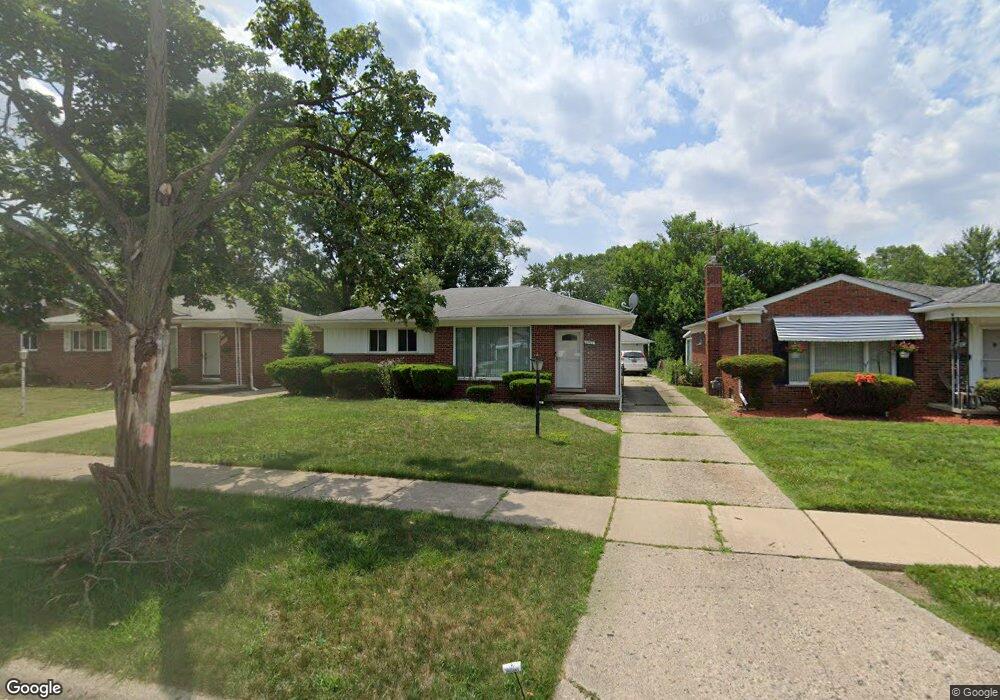
9083 Appleton Redford, MI 48239
Estimated Value: $176,036 - $202,000
3
Beds
1
Bath
1,039
Sq Ft
$183/Sq Ft
Est. Value
About This Home
This home is located at 9083 Appleton, Redford, MI 48239 and is currently estimated at $189,759, approximately $182 per square foot. 9083 Appleton is a home located in Wayne County with nearby schools including John D. Pierce Middle School, Lee M. Thurston High School, and Global Heights Academy.
Ownership History
Date
Name
Owned For
Owner Type
Purchase Details
Closed on
Sep 9, 2025
Sold by
Stanton Sheila Yvette and Scott Sheila
Bought by
Stanton Sheila Yvette and Scott Sheila
Current Estimated Value
Purchase Details
Closed on
Nov 11, 2024
Sold by
Scott Sheila and Gunter Sheila
Bought by
Scott Sheila and Gunter Sheila
Purchase Details
Closed on
Apr 14, 2009
Sold by
Secretary Of Housing & Urban Development
Bought by
Gunter Sheila
Purchase Details
Closed on
Mar 20, 2008
Sold by
Wells Fargo Bank Na
Bought by
Hud
Purchase Details
Closed on
Sep 19, 2007
Sold by
Mccoy Rita
Bought by
Wells Fargo Bank Na
Purchase Details
Closed on
Oct 21, 2004
Sold by
Kroeyr Helen M and Detz Ann
Bought by
Mccoy Rita
Purchase Details
Closed on
Sep 26, 2001
Sold by
Choinski Sophie
Bought by
Choinski Sophie
Create a Home Valuation Report for This Property
The Home Valuation Report is an in-depth analysis detailing your home's value as well as a comparison with similar homes in the area
Home Values in the Area
Average Home Value in this Area
Purchase History
| Date | Buyer | Sale Price | Title Company |
|---|---|---|---|
| Stanton Sheila Yvette | -- | None Listed On Document | |
| Scott Sheila | -- | None Listed On Document | |
| Scott Sheila | -- | None Listed On Document | |
| Gunter Sheila | $24,000 | None Available | |
| Hud | -- | None Available | |
| Wells Fargo Bank Na | $138,593 | None Available | |
| Mccoy Rita | $125,000 | Metropolitan Title Company | |
| Choinski Sophie | -- | -- |
Source: Public Records
Tax History
| Year | Tax Paid | Tax Assessment Tax Assessment Total Assessment is a certain percentage of the fair market value that is determined by local assessors to be the total taxable value of land and additions on the property. | Land | Improvement |
|---|---|---|---|---|
| 2025 | $676 | $83,200 | $0 | $0 |
| 2024 | $657 | $74,000 | $0 | $0 |
| 2023 | $629 | $63,900 | $0 | $0 |
| 2022 | $2,784 | $54,500 | $0 | $0 |
| 2021 | $2,836 | $52,300 | $0 | $0 |
| 2020 | $1,935 | $47,100 | $0 | $0 |
| 2019 | $1,764 | $36,000 | $0 | $0 |
| 2018 | $567 | $29,700 | $0 | $0 |
| 2017 | $1,960 | $27,400 | $0 | $0 |
| 2016 | $1,528 | $25,400 | $0 | $0 |
| 2015 | $2,380 | $23,800 | $0 | $0 |
| 2013 | $2,470 | $25,200 | $0 | $0 |
| 2012 | $1,690 | $27,800 | $6,900 | $20,900 |
Source: Public Records
Map
Nearby Homes