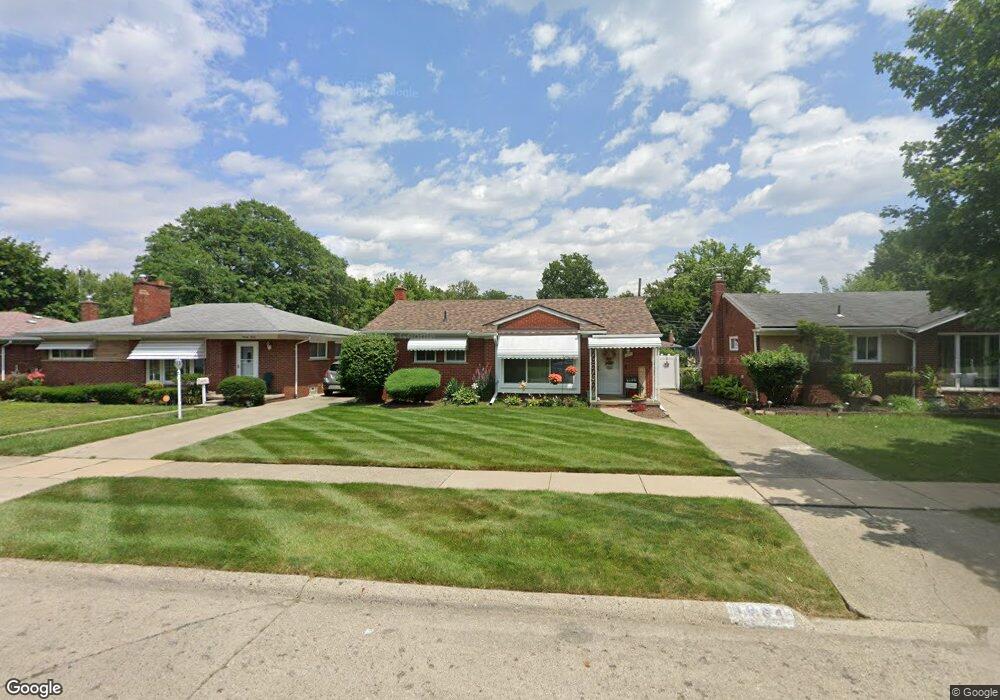
9084 Appleton Redford, MI 48239
Estimated Value: $173,078 - $207,000
3
Beds
1
Bath
1,050
Sq Ft
$183/Sq Ft
Est. Value
About This Home
This home is located at 9084 Appleton, Redford, MI 48239 and is currently estimated at $191,770, approximately $182 per square foot. 9084 Appleton is a home located in Wayne County with nearby schools including John D. Pierce Middle School, Lee M. Thurston High School, and Global Heights Academy.
Ownership History
Date
Name
Owned For
Owner Type
Purchase Details
Closed on
Jan 28, 2010
Sold by
Donovan Shaun and Secretary Of Housing & Urban D
Bought by
Willis Winifred
Current Estimated Value
Purchase Details
Closed on
May 6, 2009
Sold by
Wells Fargo Bank Na
Bought by
The Secretary Of Housing & Urban Develop
Purchase Details
Closed on
Nov 5, 2008
Sold by
Samuel Vivian B
Bought by
Wells Fargo Bank Na
Purchase Details
Closed on
Aug 22, 2002
Sold by
Hill Edward
Bought by
Samuel Vivian B
Purchase Details
Closed on
Dec 9, 1994
Sold by
Scott Mayo
Bought by
Edward Hill
Create a Home Valuation Report for This Property
The Home Valuation Report is an in-depth analysis detailing your home's value as well as a comparison with similar homes in the area
Home Values in the Area
Average Home Value in this Area
Purchase History
| Date | Buyer | Sale Price | Title Company |
|---|---|---|---|
| Willis Winifred | $27,501 | None Available | |
| The Secretary Of Housing & Urban Develop | -- | None Available | |
| Wells Fargo Bank Na | $135,077 | None Available | |
| Samuel Vivian B | $132,000 | -- | |
| Edward Hill | $63,500 | -- |
Source: Public Records
Mortgage History
| Date | Status | Borrower | Loan Amount |
|---|---|---|---|
| Closed | Samuel Vivian B | -- |
Source: Public Records
Tax History
| Year | Tax Paid | Tax Assessment Tax Assessment Total Assessment is a certain percentage of the fair market value that is determined by local assessors to be the total taxable value of land and additions on the property. | Land | Improvement |
|---|---|---|---|---|
| 2025 | $644 | $78,300 | $0 | $0 |
| 2024 | $627 | $69,700 | $0 | $0 |
| 2023 | $600 | $60,300 | $0 | $0 |
| 2022 | $2,240 | $51,400 | $0 | $0 |
| 2021 | $1,995 | $49,300 | $0 | $0 |
| 2020 | $1,728 | $43,900 | $0 | $0 |
| 2019 | $1,692 | $33,700 | $0 | $0 |
| 2018 | $541 | $28,400 | $0 | $0 |
| 2017 | $1,870 | $26,200 | $0 | $0 |
| 2016 | $1,457 | $24,300 | $0 | $0 |
| 2015 | $2,270 | $22,700 | $0 | $0 |
| 2013 | $2,350 | $24,000 | $0 | $0 |
| 2012 | $1,638 | $26,500 | $6,900 | $19,600 |
Source: Public Records
Map
Nearby Homes