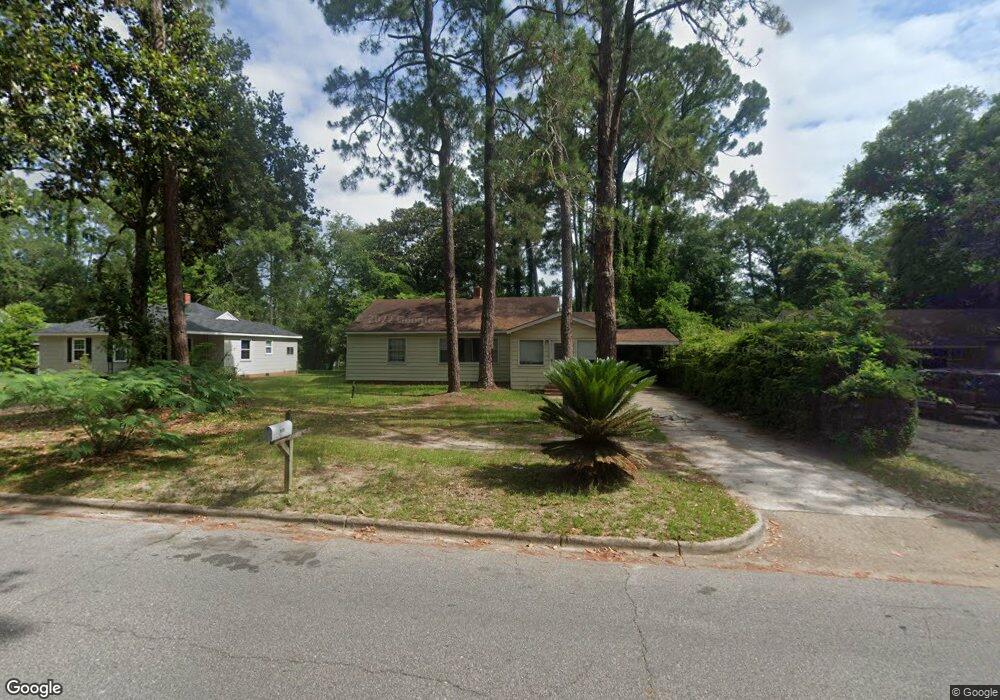
909 10th Ave Albany, GA 31701
Rawson Park NeighborhoodEstimated Value: $106,000 - $137,000
3
Beds
1
Bath
1,574
Sq Ft
$75/Sq Ft
Est. Value
About This Home
This home is located at 909 10th Ave, Albany, GA 31701 and is currently estimated at $118,397, approximately $75 per square foot. 909 10th Ave is a home located in Dougherty County with nearby schools including Northside Elementary School, Albany Middle School, and Dougherty Comprehensive High School.
Ownership History
Date
Name
Owned For
Owner Type
Purchase Details
Closed on
Apr 13, 2010
Sold by
Sb & T Bank
Bought by
Sas 646 Holding Llc
Current Estimated Value
Purchase Details
Closed on
Dec 18, 2009
Sold by
Barfield Randy L
Bought by
Sb & T Bank
Purchase Details
Closed on
Aug 7, 2002
Sold by
Thornhill Darrell G Etal
Bought by
Barfield Randy L and Barfield Cecelia M
Purchase Details
Closed on
Jan 26, 2001
Sold by
Thornhill Rubye L
Bought by
Thornhill Darrell G Etal
Purchase Details
Closed on
Jan 1, 1963
Sold by
Thornbill Herman
Bought by
Thornbill Rubye
Create a Home Valuation Report for This Property
The Home Valuation Report is an in-depth analysis detailing your home's value as well as a comparison with similar homes in the area
Home Values in the Area
Average Home Value in this Area
Purchase History
| Date | Buyer | Sale Price | Title Company |
|---|---|---|---|
| Sas 646 Holding Llc | $42,900 | -- | |
| Sb & T Bank | -- | -- | |
| Barfield Randy L | $28,500 | -- | |
| Thornhill Darrell G Etal | -- | -- | |
| Thornbill Rubye | -- | -- |
Source: Public Records
Tax History
| Year | Tax Paid | Tax Assessment Tax Assessment Total Assessment is a certain percentage of the fair market value that is determined by local assessors to be the total taxable value of land and additions on the property. | Land | Improvement |
|---|---|---|---|---|
| 2025 | $1,317 | $26,000 | $6,480 | $19,520 |
| 2024 | $1,317 | $26,000 | $6,480 | $19,520 |
| 2023 | $1,211 | $26,000 | $6,480 | $19,520 |
| 2022 | $1,216 | $26,000 | $6,480 | $19,520 |
| 2021 | $1,127 | $26,000 | $6,480 | $19,520 |
| 2020 | $1,130 | $26,000 | $6,480 | $19,520 |
| 2019 | $1,134 | $26,000 | $6,480 | $19,520 |
| 2018 | $1,139 | $26,000 | $6,480 | $19,520 |
| 2017 | $1,061 | $26,000 | $6,480 | $19,520 |
| 2016 | $1,062 | $26,000 | $6,480 | $19,520 |
| 2015 | $1,064 | $26,000 | $6,480 | $19,520 |
| 2014 | $1,064 | $26,320 | $6,800 | $19,520 |
Source: Public Records
Map
Nearby Homes
Your Personal Tour Guide
Ask me questions while you tour the home.