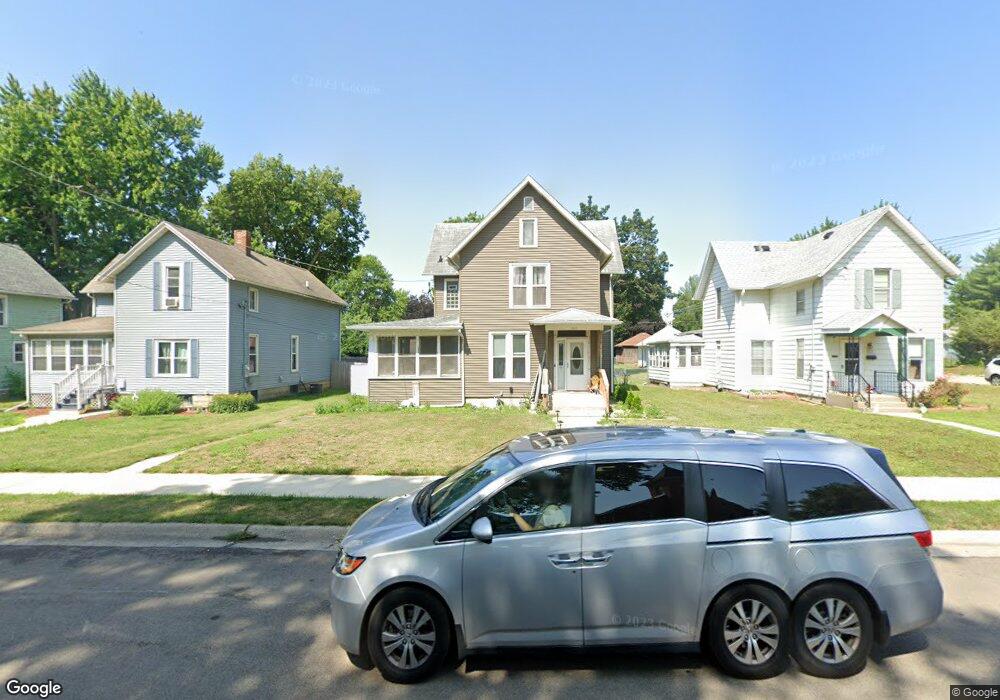
909 2nd Ave Sterling, IL 61081
Estimated Value: $113,000 - $131,000
4
Beds
2
Baths
1,675
Sq Ft
$75/Sq Ft
Est. Value
About This Home
This home is located at 909 2nd Ave, Sterling, IL 61081 and is currently estimated at $124,933, approximately $74 per square foot. 909 2nd Ave is a home located in Whiteside County with nearby schools including St. Mary's School.
Ownership History
Date
Name
Owned For
Owner Type
Purchase Details
Closed on
May 1, 2015
Sold by
Jpmorgan Chase Bank National Association
Bought by
Ibarra Esthela
Current Estimated Value
Purchase Details
Closed on
Oct 14, 2014
Sold by
Camacho Juan P
Bought by
Jpmorgan Chase Bank National Association
Purchase Details
Closed on
Jun 2, 2008
Sold by
Clark Stephanie R and Clark Jeffrey D
Bought by
Camacho Juan P
Home Financials for this Owner
Home Financials are based on the most recent Mortgage that was taken out on this home.
Original Mortgage
$74,358
Interest Rate
6.01%
Mortgage Type
New Conventional
Purchase Details
Closed on
Jan 28, 2006
Sold by
Mason Stephanie R and Clark Stephanie R
Bought by
Clark Stephanie R and Clark Jeffrey D
Home Financials for this Owner
Home Financials are based on the most recent Mortgage that was taken out on this home.
Original Mortgage
$68,000
Interest Rate
6.37%
Mortgage Type
New Conventional
Create a Home Valuation Report for This Property
The Home Valuation Report is an in-depth analysis detailing your home's value as well as a comparison with similar homes in the area
Home Values in the Area
Average Home Value in this Area
Purchase History
| Date | Buyer | Sale Price | Title Company |
|---|---|---|---|
| Ibarra Esthela | $25,000 | None Available | |
| Jpmorgan Chase Bank National Association | -- | Premier Title | |
| Camacho Juan P | $73,000 | None Available | |
| Clark Stephanie R | -- | None Available |
Source: Public Records
Mortgage History
| Date | Status | Borrower | Loan Amount |
|---|---|---|---|
| Previous Owner | Camacho Juan P | $74,358 | |
| Previous Owner | Clark Stephanie R | $68,000 |
Source: Public Records
Tax History Compared to Growth
Tax History
| Year | Tax Paid | Tax Assessment Tax Assessment Total Assessment is a certain percentage of the fair market value that is determined by local assessors to be the total taxable value of land and additions on the property. | Land | Improvement |
|---|---|---|---|---|
| 2024 | $2,696 | $31,854 | $3,482 | $28,372 |
| 2023 | $2,506 | $29,902 | $3,269 | $26,633 |
| 2022 | $2,416 | $28,609 | $3,128 | $25,481 |
| 2021 | $2,092 | $25,136 | $2,950 | $22,186 |
| 2020 | $2,011 | $24,256 | $2,847 | $21,409 |
| 2019 | $1,986 | $23,815 | $2,795 | $21,020 |
| 2018 | $1,966 | $23,853 | $2,799 | $21,054 |
| 2017 | $1,965 | $23,690 | $2,780 | $20,910 |
| 2016 | $1,893 | $22,926 | $2,690 | $20,236 |
| 2015 | $245 | $23,556 | $2,764 | $20,792 |
| 2014 | $2,447 | $23,033 | $2,703 | $20,330 |
| 2013 | $245 | $23,556 | $2,764 | $20,792 |
Source: Public Records
Map
Nearby Homes