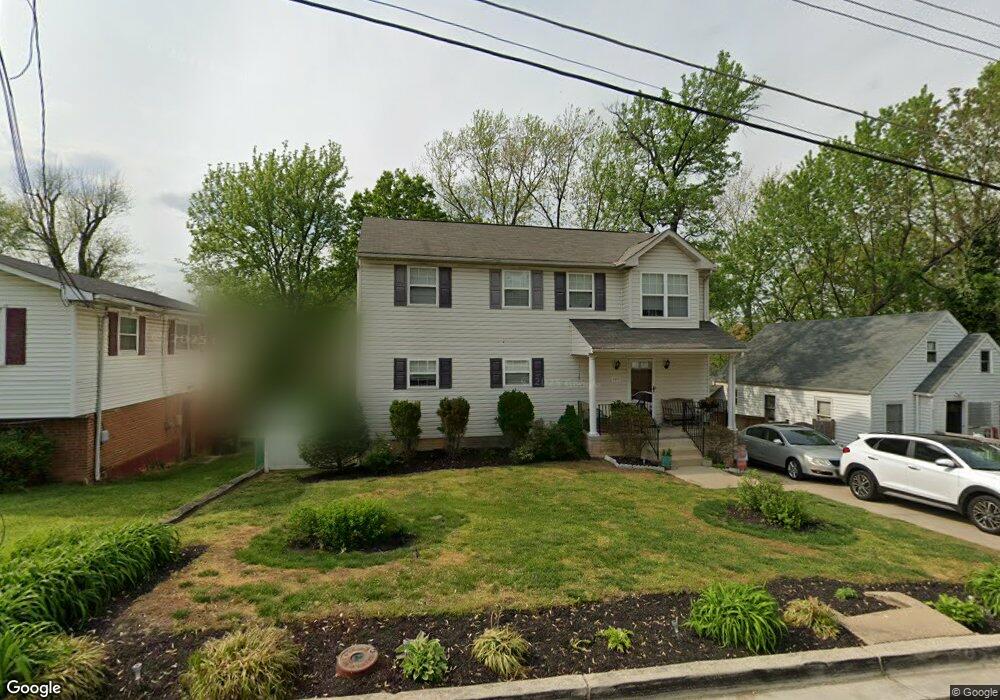
909 Balboa Ave Capitol Heights, MD 20743
Estimated Value: $359,000 - $500,000
--
Bed
4
Baths
1,992
Sq Ft
$219/Sq Ft
Est. Value
About This Home
This home is located at 909 Balboa Ave, Capitol Heights, MD 20743 and is currently estimated at $436,455, approximately $219 per square foot. 909 Balboa Ave is a home located in Prince George's County with nearby schools including William W. Hall Academy, Suitland High School, and Rocketship Dc Public Charter School - Legacy Prep.
Ownership History
Date
Name
Owned For
Owner Type
Purchase Details
Closed on
Jul 7, 2006
Sold by
Adofo Samuel
Bought by
Gandy Dervalle K
Current Estimated Value
Home Financials for this Owner
Home Financials are based on the most recent Mortgage that was taken out on this home.
Original Mortgage
$337,500
Outstanding Balance
$201,734
Interest Rate
6.87%
Mortgage Type
Purchase Money Mortgage
Estimated Equity
$234,721
Purchase Details
Closed on
Jun 29, 2006
Sold by
Adofo Samuel
Bought by
Gandy Dervalle K
Home Financials for this Owner
Home Financials are based on the most recent Mortgage that was taken out on this home.
Original Mortgage
$337,500
Outstanding Balance
$201,734
Interest Rate
6.87%
Mortgage Type
Purchase Money Mortgage
Estimated Equity
$234,721
Purchase Details
Closed on
Mar 16, 2005
Sold by
Murphy Eddie J
Bought by
Adofo Samuel
Purchase Details
Closed on
Apr 26, 1973
Sold by
Bice Aca M and Bice Ange
Bought by
Murphy Eddie J and Murphy Inez S
Create a Home Valuation Report for This Property
The Home Valuation Report is an in-depth analysis detailing your home's value as well as a comparison with similar homes in the area
Home Values in the Area
Average Home Value in this Area
Purchase History
| Date | Buyer | Sale Price | Title Company |
|---|---|---|---|
| Gandy Dervalle K | $375,000 | -- | |
| Gandy Dervalle K | $375,000 | -- | |
| Adofo Samuel | $80,000 | -- | |
| Murphy Eddie J | $16,300 | -- |
Source: Public Records
Mortgage History
| Date | Status | Borrower | Loan Amount |
|---|---|---|---|
| Open | Adofo Samuel | $337,500 | |
| Closed | Gandy Dervalle K | $337,500 |
Source: Public Records
Tax History Compared to Growth
Tax History
| Year | Tax Paid | Tax Assessment Tax Assessment Total Assessment is a certain percentage of the fair market value that is determined by local assessors to be the total taxable value of land and additions on the property. | Land | Improvement |
|---|---|---|---|---|
| 2025 | $4,882 | $393,333 | -- | -- |
| 2024 | $4,882 | $380,767 | $0 | $0 |
| 2023 | $4,743 | $368,200 | $60,200 | $308,000 |
| 2022 | $4,094 | $368,200 | $60,200 | $308,000 |
| 2021 | $9,127 | $368,200 | $60,200 | $308,000 |
| 2020 | $9,039 | $435,700 | $45,100 | $390,600 |
| 2019 | $3,291 | $417,600 | $0 | $0 |
| 2018 | $4,027 | $399,500 | $0 | $0 |
| 2017 | $3,780 | $381,400 | $0 | $0 |
| 2016 | -- | $323,567 | $0 | $0 |
| 2015 | $4,576 | $265,733 | $0 | $0 |
| 2014 | $4,576 | $207,900 | $0 | $0 |
Source: Public Records
Map
Nearby Homes
- 836 Balboa Ave
- 922 Abel Ave
- 921 Balboa Ave
- 944 Balboa Ave
- 5219 F St SE
- 5217 F St SE
- 4905 Fable St
- 4607 Gunther St
- 1011 Balboa Ave
- 1001 Iago Ave
- 628 Clovis Ave
- 1012 Abel Ave
- 5125 H St SE
- 5102 Fitch St SE
- 5100 F St SE Unit 7
- 5332 D St SE
- 5002 Kimi Gray Ct SE
- 5032 Hanna Place SE
- 605 Elfin Ave
- 530 Abel Ave