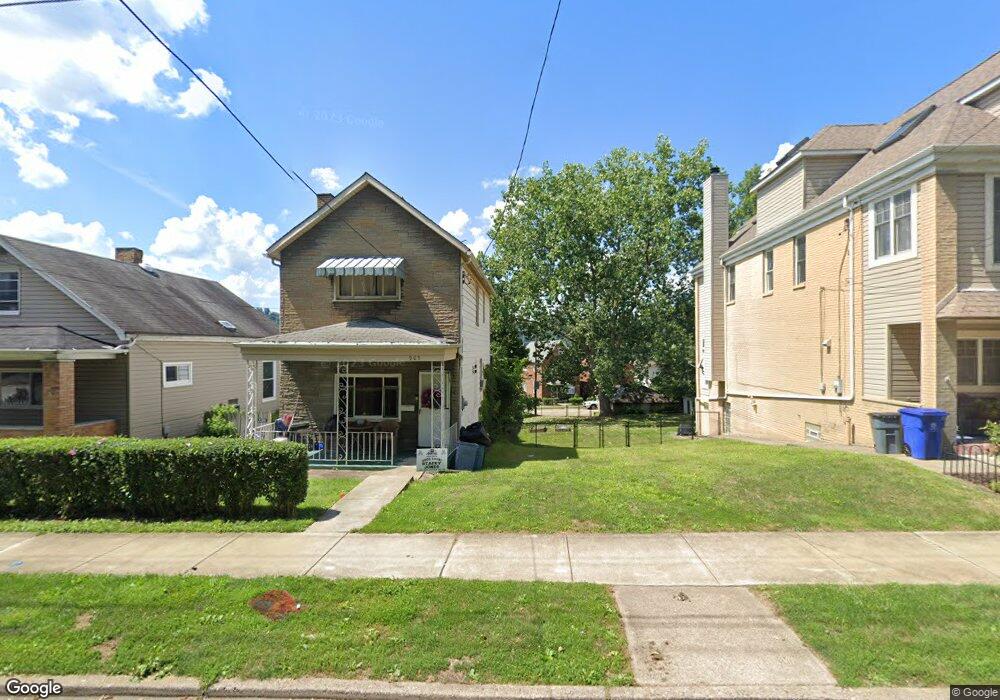
909 Beaver Rd Ambridge, PA 15003
Estimated Value: $15,870 - $133,000
3
Beds
1
Bath
1,900
Sq Ft
$49/Sq Ft
Est. Value
About This Home
This home is located at 909 Beaver Rd, Ambridge, PA 15003 and is currently estimated at $92,718, approximately $48 per square foot. 909 Beaver Rd is a home located in Beaver County with nearby schools including Ambridge Area Middle School and Ambridge Area High School.
Ownership History
Date
Name
Owned For
Owner Type
Purchase Details
Closed on
Jul 20, 2018
Sold by
Beaver County Tax Claim Bureau
Bought by
Laurello Stacey D
Current Estimated Value
Purchase Details
Closed on
Dec 26, 2000
Sold by
Storey William J
Bought by
Colbert Judith L
Home Financials for this Owner
Home Financials are based on the most recent Mortgage that was taken out on this home.
Original Mortgage
$31,875
Interest Rate
7.52%
Create a Home Valuation Report for This Property
The Home Valuation Report is an in-depth analysis detailing your home's value as well as a comparison with similar homes in the area
Home Values in the Area
Average Home Value in this Area
Purchase History
| Date | Buyer | Sale Price | Title Company |
|---|---|---|---|
| Laurello Stacey D | $8,159 | None Available | |
| Laurello Stacey D | $1,715 | None Available | |
| Colbert Judith L | $42,500 | -- |
Source: Public Records
Mortgage History
| Date | Status | Borrower | Loan Amount |
|---|---|---|---|
| Previous Owner | Colbert Judith L | $31,875 |
Source: Public Records
Tax History Compared to Growth
Tax History
| Year | Tax Paid | Tax Assessment Tax Assessment Total Assessment is a certain percentage of the fair market value that is determined by local assessors to be the total taxable value of land and additions on the property. | Land | Improvement |
|---|---|---|---|---|
| 2025 | $21 | $1,600 | $1,600 | -- |
| 2024 | $71 | $1,600 | $1,600 | -- |
| 2023 | $295 | $2,050 | $2,050 | $0 |
| 2022 | $295 | $2,050 | $2,050 | $0 |
| 2021 | $295 | $2,050 | $2,050 | $0 |
| 2020 | $291 | $2,050 | $2,050 | $0 |
| 2019 | $291 | $2,050 | $2,050 | $0 |
| 2018 | $2,565 | $18,350 | $2,050 | $16,300 |
| 2017 | $2,565 | $18,350 | $2,050 | $16,300 |
| 2016 | $2,433 | $18,350 | $2,050 | $16,300 |
| 2015 | $407 | $18,350 | $2,050 | $16,300 |
| 2014 | $407 | $18,350 | $2,050 | $16,300 |
Source: Public Records
Map
Nearby Homes