Estimated Value: $89,517 - $116,000
2
Beds
1
Bath
896
Sq Ft
$116/Sq Ft
Est. Value
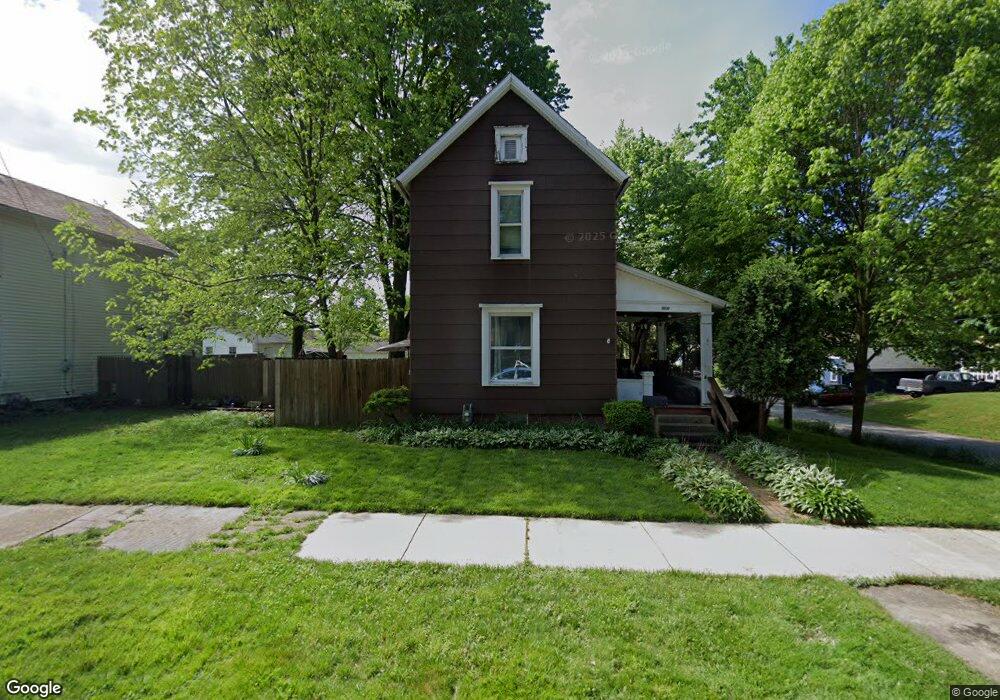
About This Home
This home is located at 909 E 5th St, Salem, OH 44460 and is currently estimated at $103,629, approximately $115 per square foot. 909 E 5th St is a home located in Columbiana County with nearby schools including Reilly Elementary School, Buckeye Elementary School, and Salem Junior High School.
Ownership History
Date
Name
Owned For
Owner Type
Purchase Details
Closed on
Dec 21, 2000
Sold by
Cheuvront Jarrin M and Cheuvront Sara A
Bought by
Pagani Dominic S
Current Estimated Value
Home Financials for this Owner
Home Financials are based on the most recent Mortgage that was taken out on this home.
Original Mortgage
$44,800
Outstanding Balance
$16,865
Interest Rate
8%
Estimated Equity
$86,764
Purchase Details
Closed on
Mar 2, 1998
Sold by
Shank Jeffrey
Bought by
Cheuvront Jarrin M and Cheuvront Sara A
Home Financials for this Owner
Home Financials are based on the most recent Mortgage that was taken out on this home.
Original Mortgage
$35,200
Interest Rate
6.95%
Purchase Details
Closed on
Oct 28, 1997
Sold by
Kelly Thomas R
Bought by
Jeffrey A Shank
Purchase Details
Closed on
Feb 28, 1994
Bought by
Kelly Thomas R and Kelly Or
Create a Home Valuation Report for This Property
The Home Valuation Report is an in-depth analysis detailing your home's value as well as a comparison with similar homes in the area
Home Values in the Area
Average Home Value in this Area
Purchase History
| Date | Buyer | Sale Price | Title Company |
|---|---|---|---|
| Pagani Dominic S | $56,000 | Union Title Company | |
| Cheuvront Jarrin M | -- | Union Title Company | |
| Jeffrey A Shank | $40,500 | -- | |
| Kelly Thomas R | $25,000 | -- |
Source: Public Records
Mortgage History
| Date | Status | Borrower | Loan Amount |
|---|---|---|---|
| Open | Pagani Dominic S | $44,800 | |
| Previous Owner | Cheuvront Jarrin M | $35,200 | |
| Closed | Pagani Dominic S | $11,200 |
Source: Public Records
Tax History
| Year | Tax Paid | Tax Assessment Tax Assessment Total Assessment is a certain percentage of the fair market value that is determined by local assessors to be the total taxable value of land and additions on the property. | Land | Improvement |
|---|---|---|---|---|
| 2024 | $878 | $22,370 | $4,760 | $17,610 |
| 2023 | $880 | $22,370 | $4,760 | $17,610 |
| 2022 | $814 | $22,370 | $4,760 | $17,610 |
| 2021 | $814 | $20,940 | $5,710 | $15,230 |
| 2020 | $821 | $20,940 | $5,710 | $15,230 |
| 2019 | $820 | $20,940 | $5,710 | $15,230 |
| 2018 | $779 | $19,010 | $5,180 | $13,830 |
| 2017 | $779 | $19,010 | $5,180 | $13,830 |
| 2016 | $775 | $18,760 | $6,230 | $12,530 |
| 2015 | $775 | $18,760 | $6,230 | $12,530 |
| 2014 | $762 | $18,760 | $6,230 | $12,530 |
Source: Public Records
Map
Nearby Homes
- 879 E 4th St
- 0 Rose Ave
- 267 Hawley Ave
- 242 Vine St
- 651 E 6th St
- 676 E 3rd St Unit 684
- 512 N Union Ave
- 605 E 8th St
- 110 Woodland Ave
- 401 Highland Ave
- 245 Highland Ave
- 1273 E State St
- 246 E 7th St
- 492 N Ellsworth Ave
- 1408 E Pershing St
- 339 S Union Ave
- 1440 E 10th St
- 1723 E 3rd St
- 1264 N Lincoln Ave
- 264 W Wilson St
Your Personal Tour Guide
Ask me questions while you tour the home.