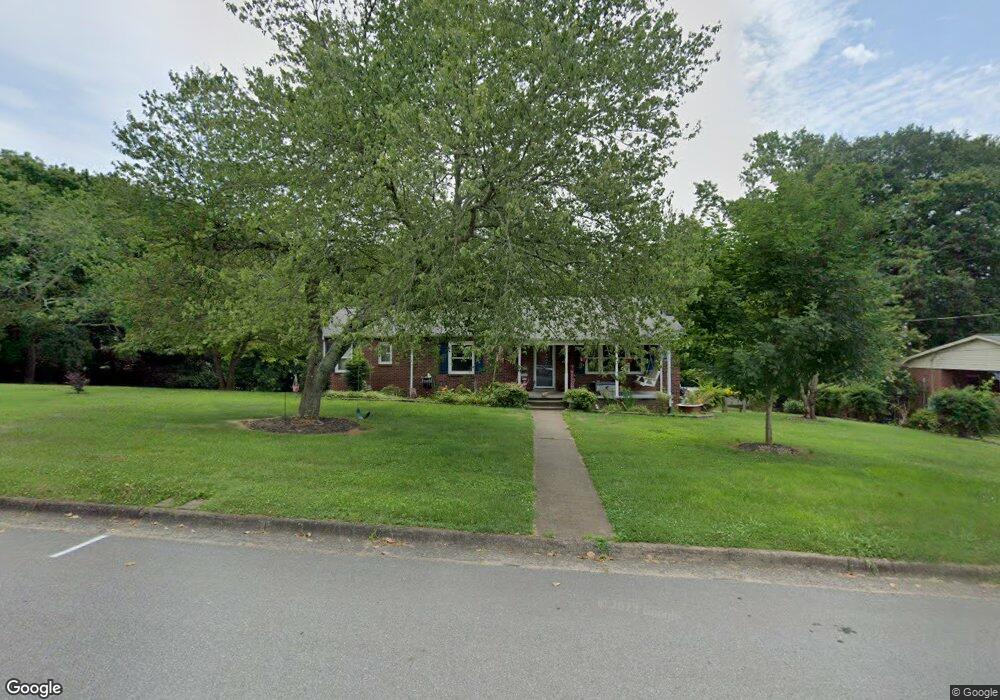
909 Eastview St Shelby, NC 28152
Estimated Value: $190,000 - $238,000
3
Beds
2
Baths
1,700
Sq Ft
$129/Sq Ft
Est. Value
About This Home
This home is located at 909 Eastview St, Shelby, NC 28152 and is currently estimated at $218,744, approximately $128 per square foot. 909 Eastview St is a home located in Cleveland County with nearby schools including Graham Elementary School, James Love Elementary School, and Shelby Middle School.
Ownership History
Date
Name
Owned For
Owner Type
Purchase Details
Closed on
Sep 6, 2023
Sold by
Vanburen Raymond A and Vanburen Julia L
Bought by
Humes Kentin
Current Estimated Value
Home Financials for this Owner
Home Financials are based on the most recent Mortgage that was taken out on this home.
Original Mortgage
$93,460
Outstanding Balance
$91,421
Interest Rate
6.81%
Mortgage Type
New Conventional
Estimated Equity
$127,323
Create a Home Valuation Report for This Property
The Home Valuation Report is an in-depth analysis detailing your home's value as well as a comparison with similar homes in the area
Home Values in the Area
Average Home Value in this Area
Purchase History
| Date | Buyer | Sale Price | Title Company |
|---|---|---|---|
| Humes Kentin | -- | None Listed On Document |
Source: Public Records
Mortgage History
| Date | Status | Borrower | Loan Amount |
|---|---|---|---|
| Open | Humes Kentin | $93,460 |
Source: Public Records
Tax History Compared to Growth
Tax History
| Year | Tax Paid | Tax Assessment Tax Assessment Total Assessment is a certain percentage of the fair market value that is determined by local assessors to be the total taxable value of land and additions on the property. | Land | Improvement |
|---|---|---|---|---|
| 2025 | $1,944 | $195,353 | $24,019 | $171,334 |
| 2024 | $1,115 | $90,481 | $18,014 | $72,467 |
| 2023 | $1,110 | $90,481 | $18,014 | $72,467 |
| 2022 | $1,110 | $90,481 | $18,014 | $72,467 |
| 2021 | $1,115 | $90,481 | $18,014 | $72,467 |
| 2020 | $873 | $68,453 | $15,012 | $53,441 |
| 2019 | $873 | $68,453 | $15,012 | $53,441 |
| 2018 | $871 | $68,453 | $15,012 | $53,441 |
| 2017 | $850 | $68,453 | $15,012 | $53,441 |
| 2016 | $852 | $68,453 | $15,012 | $53,441 |
| 2015 | $1,181 | $100,619 | $16,513 | $84,106 |
| 2014 | $1,181 | $100,619 | $16,513 | $84,106 |
Source: Public Records
Map
Nearby Homes