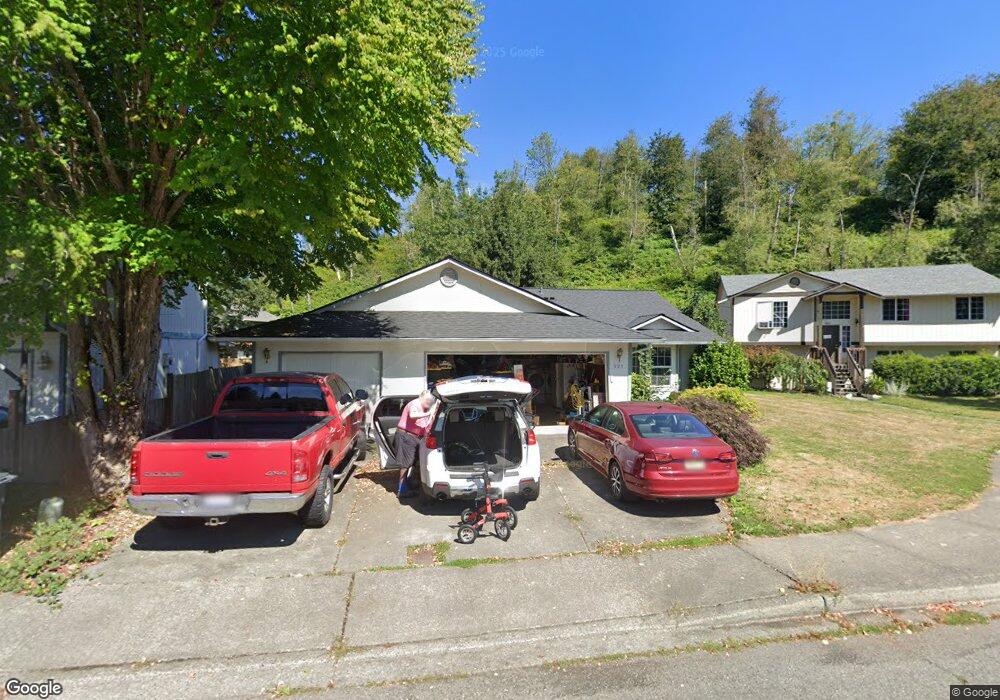
909 Elm St Sultan, WA 98294
Estimated Value: $470,000 - $532,000
3
Beds
2
Baths
1,076
Sq Ft
$467/Sq Ft
Est. Value
About This Home
This home is located at 909 Elm St, Sultan, WA 98294 and is currently estimated at $502,977, approximately $467 per square foot. 909 Elm St is a home located in Snohomish County with nearby schools including Sultan Senior High School.
Ownership History
Date
Name
Owned For
Owner Type
Purchase Details
Closed on
Dec 16, 2008
Sold by
Maldonado Mike Angel and Maldonado Brenda J
Bought by
Still Kerrie
Current Estimated Value
Home Financials for this Owner
Home Financials are based on the most recent Mortgage that was taken out on this home.
Original Mortgage
$229,500
Outstanding Balance
$151,419
Interest Rate
6.1%
Mortgage Type
Purchase Money Mortgage
Estimated Equity
$351,558
Purchase Details
Closed on
Mar 27, 1998
Sold by
Biermanski Jeffrey P and Biermanski Denise R
Bought by
Maldonado Mike Angel and Maldonado Brenda J
Home Financials for this Owner
Home Financials are based on the most recent Mortgage that was taken out on this home.
Original Mortgage
$134,356
Interest Rate
7.06%
Mortgage Type
FHA
Purchase Details
Closed on
Oct 31, 1996
Sold by
Cmi Inc
Bought by
Biermanski Jeffrey P and Wiltse Denise R
Home Financials for this Owner
Home Financials are based on the most recent Mortgage that was taken out on this home.
Original Mortgage
$123,415
Interest Rate
8.14%
Mortgage Type
FHA
Create a Home Valuation Report for This Property
The Home Valuation Report is an in-depth analysis detailing your home's value as well as a comparison with similar homes in the area
Home Values in the Area
Average Home Value in this Area
Purchase History
| Date | Buyer | Sale Price | Title Company |
|---|---|---|---|
| Still Kerrie | $225,000 | Pnwt | |
| Maldonado Mike Angel | $138,000 | Evergreen Title Co | |
| Biermanski Jeffrey P | $124,200 | Chicago Title Ins Co |
Source: Public Records
Mortgage History
| Date | Status | Borrower | Loan Amount |
|---|---|---|---|
| Open | Still Kerrie | $229,500 | |
| Previous Owner | Maldonado Mike Angel | $134,356 | |
| Previous Owner | Biermanski Jeffrey P | $123,415 |
Source: Public Records
Tax History Compared to Growth
Tax History
| Year | Tax Paid | Tax Assessment Tax Assessment Total Assessment is a certain percentage of the fair market value that is determined by local assessors to be the total taxable value of land and additions on the property. | Land | Improvement |
|---|---|---|---|---|
| 2025 | $3,620 | $431,000 | $217,000 | $214,000 |
| 2024 | $3,620 | $408,600 | $197,000 | $211,600 |
| 2023 | $3,326 | $424,900 | $206,000 | $218,900 |
| 2022 | $2,996 | $328,700 | $155,000 | $173,700 |
| 2020 | $2,703 | $269,700 | $115,000 | $154,700 |
| 2019 | $2,464 | $255,500 | $110,000 | $145,500 |
| 2018 | $2,723 | $228,600 | $93,000 | $135,600 |
| 2017 | $2,109 | $175,400 | $70,000 | $105,400 |
| 2016 | $2,209 | $179,700 | $57,000 | $122,700 |
| 2015 | $2,069 | $157,600 | $46,000 | $111,600 |
| 2013 | $1,711 | $126,800 | $44,000 | $82,800 |
Source: Public Records
Map
Nearby Homes
- 712 Alder St
- 404 11th St
- 604 Stevens Ave
- 306 3rd St
- 507 3rd St
- 204 Date Ave
- 870 4th St
- 512 1st St
- 415 1st St
- 14055 Sultan Basin Rd
- 405 Amberwood Cir
- 907 Bryant Rd
- 207 Willow Ave
- 32302 135th Place SE
- 32306 135th Place SE
- 32310 135th Place SE
- 13432 323rd Dr SE
- 13422 323rd Ave SE
- 13433 323rd Ave SE
- 1338 Cascade St