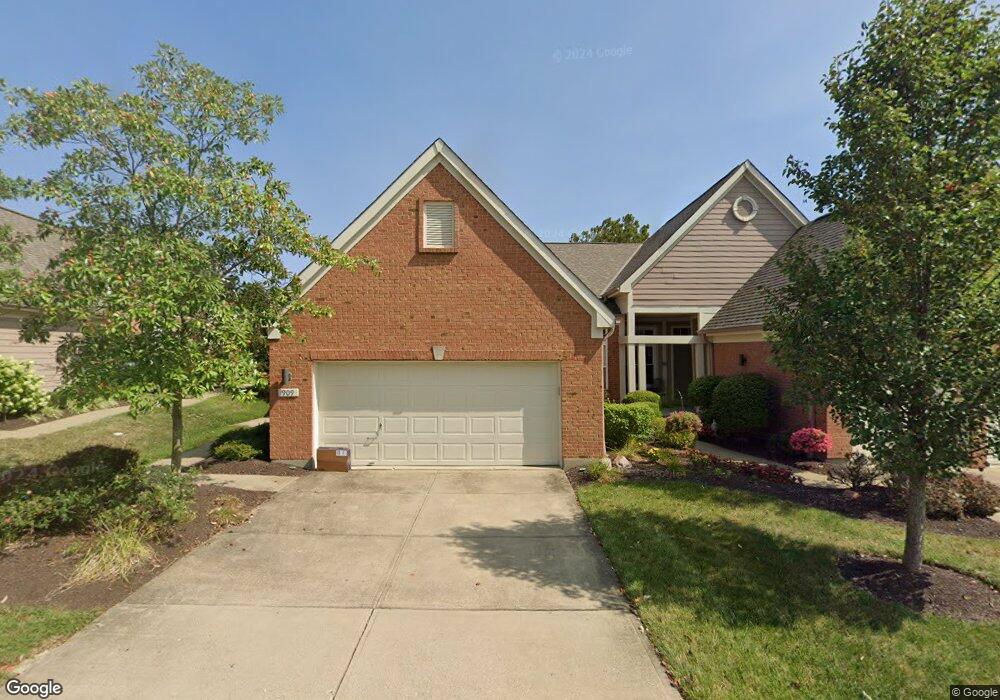
909 Grand Cypress Ct Unit 6A Cincinnati, OH 45245
Estimated Value: $387,000 - $423,000
3
Beds
2
Baths
1,424
Sq Ft
$282/Sq Ft
Est. Value
About This Home
This home is located at 909 Grand Cypress Ct Unit 6A, Cincinnati, OH 45245 and is currently estimated at $401,012, approximately $281 per square foot. 909 Grand Cypress Ct Unit 6A is a home located in Clermont County with nearby schools including Locust Corner Elementary School, New Richmond Middle School, and New Richmond High School.
Ownership History
Date
Name
Owned For
Owner Type
Purchase Details
Closed on
Feb 17, 2006
Sold by
Ridolfo Edward J and Ridolfo Ruth H
Bought by
Buenemann Roger L and Buenemann Nancy S
Current Estimated Value
Home Financials for this Owner
Home Financials are based on the most recent Mortgage that was taken out on this home.
Original Mortgage
$188,000
Interest Rate
6.2%
Mortgage Type
Fannie Mae Freddie Mac
Purchase Details
Closed on
May 4, 2000
Sold by
Legendary Run Builders I
Bought by
Ridolfo Edward J and Ridolfo Ruth H
Home Financials for this Owner
Home Financials are based on the most recent Mortgage that was taken out on this home.
Original Mortgage
$188,000
Interest Rate
8.24%
Mortgage Type
New Conventional
Create a Home Valuation Report for This Property
The Home Valuation Report is an in-depth analysis detailing your home's value as well as a comparison with similar homes in the area
Home Values in the Area
Average Home Value in this Area
Purchase History
| Date | Buyer | Sale Price | Title Company |
|---|---|---|---|
| Buenemann Roger L | $313,333 | Tri Star Title Agency Inc | |
| Ridolfo Edward J | $239,000 | -- |
Source: Public Records
Mortgage History
| Date | Status | Borrower | Loan Amount |
|---|---|---|---|
| Previous Owner | Buenemann Roger L | $188,000 | |
| Previous Owner | Ridolfo Edward J | $188,000 |
Source: Public Records
Tax History Compared to Growth
Tax History
| Year | Tax Paid | Tax Assessment Tax Assessment Total Assessment is a certain percentage of the fair market value that is determined by local assessors to be the total taxable value of land and additions on the property. | Land | Improvement |
|---|---|---|---|---|
| 2024 | $4,619 | $107,910 | $16,100 | $91,810 |
| 2023 | $4,627 | $107,910 | $16,100 | $91,810 |
| 2022 | $4,715 | $88,070 | $13,130 | $74,940 |
| 2021 | $4,641 | $88,070 | $13,130 | $74,940 |
| 2020 | $4,623 | $88,070 | $13,130 | $74,940 |
| 2019 | $3,927 | $83,590 | $12,990 | $70,600 |
| 2018 | $3,928 | $83,590 | $12,990 | $70,600 |
| 2017 | $3,908 | $83,590 | $12,990 | $70,600 |
| 2016 | $4,130 | $81,130 | $12,600 | $68,530 |
| 2015 | $3,592 | $81,130 | $12,600 | $68,530 |
| 2014 | $3,592 | $81,130 | $12,600 | $68,530 |
| 2013 | $3,295 | $73,890 | $11,340 | $62,550 |
Source: Public Records
Map
Nearby Homes
- 891 Cypresspoint Ct
- 3450 Behymer Rd
- 927 E Legendary Run
- 3815 Sturbridge Way
- 3790 Prestwick Cir
- 3779 Sturbridge Way
- 1001 Castlebay
- 3767 Sturbridge Way
- The McPherson Plan at Prestwick Place - Designer Collection
- Wyatt Plan at Prestwick Place - Designer Collection
- Blair Plan at Prestwick Place - Designer Collection
- Finley Plan at Prestwick Place - Masterpiece Collection
- Margot Plan at Prestwick Place - Masterpiece Collection
- Teagan Plan at Prestwick Place - Masterpiece Collection
- Huxley Plan at Prestwick Place - Masterpiece Collection
- Clay Plan at Prestwick Place - Masterpiece Collection
- Winslow Plan at Prestwick Place - Masterpiece Collection
- Pearson Plan at Prestwick Place - Masterpiece Collection
- Mitchell Plan at Prestwick Place - Masterpiece Collection
- Everett Plan at Prestwick Place - Masterpiece Collection
- 907 Grand Cypress Ct
- 905 Grand Cypress Ct
- 911 Grand Cypress Ct
- 903 Grand Cypress Ct
- 913 Grand Cypress Ct Unit 5C
- 901 Grand Cypress Ct
- 915 Grand Cypress Ct
- 889 Grand Cypress Ct Unit 7B
- 917 Grand Cypress Ct
- 887 Grand Cypress Ct Unit 7C
- 895 Cypresspoint Ct
- 885 Grand Cypress Ct Unit 7D
- 919 Grand Cypress Ct
- 893 Cypresspoint Ct
- 921 Grand Cypress Ct
- 889 Cypresspoint Ct
- 3503 Behymer Rd
- 923 Grand Cypress Ct
- 925 Grand Cypress Ct
- 883 Grand Cypress Ct Unit 8A