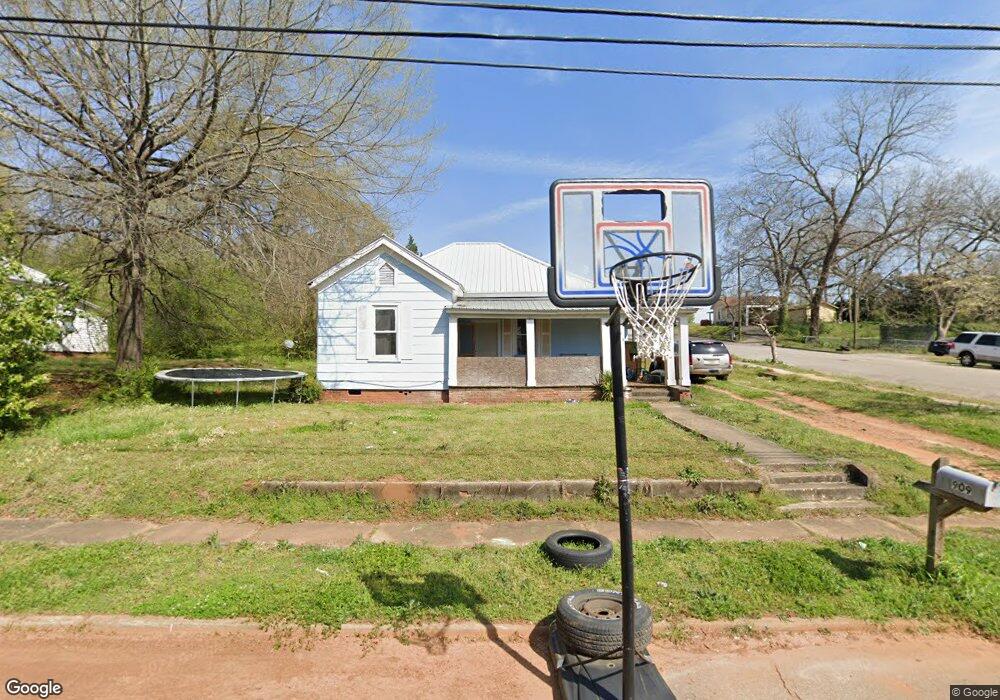
909 Juniper St Lagrange, GA 30240
Estimated Value: $99,000 - $189,000
3
Beds
1
Bath
1,640
Sq Ft
$80/Sq Ft
Est. Value
About This Home
This home is located at 909 Juniper St, Lagrange, GA 30240 and is currently estimated at $131,667, approximately $80 per square foot. 909 Juniper St is a home located in Troup County with nearby schools including Berta Weathersbee Elementary School, Whitesville Road Elementary School, and Rosemont Elementary School.
Ownership History
Date
Name
Owned For
Owner Type
Purchase Details
Closed on
May 23, 2024
Sold by
Miller Martin J
Bought by
Miller Martin J and Miller Melinda H
Current Estimated Value
Purchase Details
Closed on
Jul 3, 2001
Sold by
Alison S Scott
Bought by
Miller Martin J
Purchase Details
Closed on
Feb 22, 2001
Sold by
David Key
Bought by
Alison S Scott
Purchase Details
Closed on
Nov 10, 2000
Sold by
Assoc Home Equity Services Inc
Bought by
David Key
Purchase Details
Closed on
Jun 22, 2000
Sold by
Richard Cox
Bought by
Assoc Home Equity Services Inc
Purchase Details
Closed on
Jul 2, 1999
Sold by
Mckeen Lamar
Bought by
Richard Cox
Purchase Details
Closed on
Jun 6, 1995
Sold by
Freddie May
Bought by
Mckeen Lamar
Purchase Details
Closed on
Jun 5, 1995
Sold by
Mary May
Bought by
Freddie May
Purchase Details
Closed on
Aug 8, 1974
Sold by
May T P
Bought by
Mary May
Purchase Details
Closed on
Sep 1, 1946
Sold by
Duncan Chester L
Bought by
May T P
Create a Home Valuation Report for This Property
The Home Valuation Report is an in-depth analysis detailing your home's value as well as a comparison with similar homes in the area
Purchase History
| Date | Buyer | Sale Price | Title Company |
|---|---|---|---|
| Miller Martin J | -- | -- | |
| Miller Martin J | $53,000 | -- | |
| Alison S Scott | $27,500 | -- | |
| David Key | $16,000 | -- | |
| Assoc Home Equity Services Inc | $50,700 | -- | |
| Richard Cox | $45,000 | -- | |
| Mckeen Lamar | -- | -- | |
| Freddie May | $12,500 | -- | |
| Mary May | -- | -- | |
| May T P | -- | -- |
Source: Public Records
Tax History
| Year | Tax Paid | Tax Assessment Tax Assessment Total Assessment is a certain percentage of the fair market value that is determined by local assessors to be the total taxable value of land and additions on the property. | Land | Improvement |
|---|---|---|---|---|
| 2025 | $844 | $30,960 | $2,800 | $28,160 |
| 2024 | $756 | $27,720 | $2,800 | $24,920 |
| 2023 | $622 | $22,800 | $2,800 | $20,000 |
| 2022 | $602 | $21,560 | $2,800 | $18,760 |
| 2021 | $379 | $12,560 | $2,800 | $9,760 |
| 2020 | $379 | $12,560 | $2,800 | $9,760 |
| 2019 | $389 | $12,906 | $2,346 | $10,560 |
| 2018 | $389 | $12,906 | $2,346 | $10,560 |
| 2017 | $389 | $12,906 | $2,346 | $10,560 |
| 2016 | $381 | $12,630 | $2,346 | $10,284 |
| 2015 | $374 | $12,389 | $2,105 | $10,284 |
| 2014 | $302 | $9,986 | $2,752 | $7,234 |
| 2013 | -- | $10,555 | $2,752 | $7,803 |
Source: Public Records
Map
Nearby Homes
- 712 Poplar St
- 907 Juniper St
- 1001 Juniper St
- 908 Juniper St
- 908 Murphy Ave
- 1000 Juniper St
- 905 Juniper St
- 906 Murphy Ave
- 906 Juniper St
- 1003 Juniper St
- 1000 Murphy Ave
- 904 Murphy Ave
- 904 Juniper St
- 903 Juniper St
- 1002 Juniper St
- 1002 Murphy Ave
- 1005 Juniper St
- 902 Murphy Ave
- 902 Juniper St
- 909 Park Ave
Your Personal Tour Guide
Ask me questions while you tour the home.