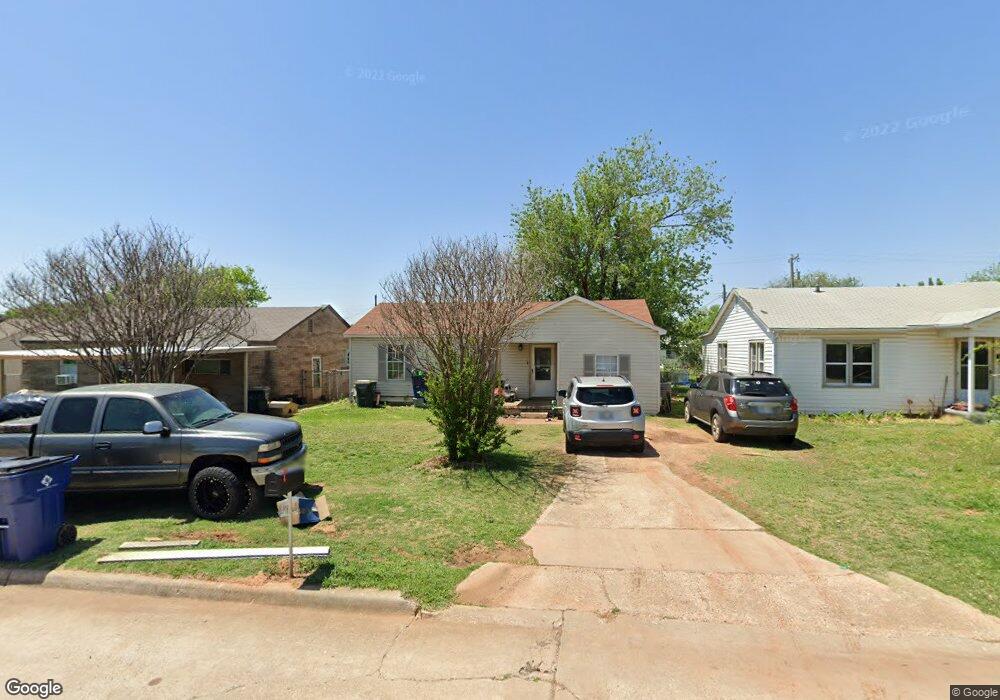
909 N C St Duncan, OK 73533
Estimated Value: $44,000 - $58,226
2
Beds
1
Bath
1,080
Sq Ft
$49/Sq Ft
Est. Value
About This Home
This home is located at 909 N C St, Duncan, OK 73533 and is currently estimated at $53,057, approximately $49 per square foot. 909 N C St is a home located in Stephens County with nearby schools including Woodrow Wilson Elementary School, Duncan Middle School, and Duncan High School.
Ownership History
Date
Name
Owned For
Owner Type
Purchase Details
Closed on
Jan 22, 2008
Sold by
Gore Matthew D and Gore Stephanie M
Bought by
Chadd David
Current Estimated Value
Home Financials for this Owner
Home Financials are based on the most recent Mortgage that was taken out on this home.
Original Mortgage
$28,200
Interest Rate
5.94%
Mortgage Type
Purchase Money Mortgage
Purchase Details
Closed on
May 27, 2005
Sold by
Sparks Angela D
Bought by
Gore Matthew D and Gore Stephanie M
Home Financials for this Owner
Home Financials are based on the most recent Mortgage that was taken out on this home.
Original Mortgage
$41,670
Interest Rate
5.87%
Mortgage Type
FHA
Purchase Details
Closed on
Apr 11, 2000
Sold by
Delta Community Action
Purchase Details
Closed on
Dec 28, 1999
Sold by
Delta Community Action
Purchase Details
Closed on
Apr 9, 1992
Sold by
Garrett Bruce R
Create a Home Valuation Report for This Property
The Home Valuation Report is an in-depth analysis detailing your home's value as well as a comparison with similar homes in the area
Home Values in the Area
Average Home Value in this Area
Purchase History
| Date | Buyer | Sale Price | Title Company |
|---|---|---|---|
| Chadd David | $31,000 | None Available | |
| Gore Matthew D | $42,000 | Stewart Escrow & Title | |
| -- | -- | -- | |
| -- | $37,000 | -- | |
| -- | -- | -- |
Source: Public Records
Mortgage History
| Date | Status | Borrower | Loan Amount |
|---|---|---|---|
| Closed | Chadd David | $28,200 | |
| Previous Owner | Gore Matthew D | $41,670 |
Source: Public Records
Tax History Compared to Growth
Tax History
| Year | Tax Paid | Tax Assessment Tax Assessment Total Assessment is a certain percentage of the fair market value that is determined by local assessors to be the total taxable value of land and additions on the property. | Land | Improvement |
|---|---|---|---|---|
| 2025 | $364 | $4,484 | $356 | $4,128 |
| 2024 | $364 | $4,270 | $356 | $3,914 |
| 2023 | $364 | $4,270 | $356 | $3,914 |
| 2022 | $329 | $4,040 | $356 | $3,684 |
| 2021 | $329 | $3,873 | $356 | $3,517 |
| 2020 | $303 | $3,514 | $356 | $3,158 |
| 2019 | $294 | $3,401 | $356 | $3,045 |
| 2018 | $303 | $3,401 | $356 | $3,045 |
| 2017 | $289 | $3,532 | $356 | $3,176 |
| 2016 | $272 | $3,204 | $356 | $2,848 |
| 2015 | $341 | $3,204 | $356 | $2,848 |
| 2014 | $341 | $3,204 | $356 | $2,848 |
Source: Public Records
Map
Nearby Homes