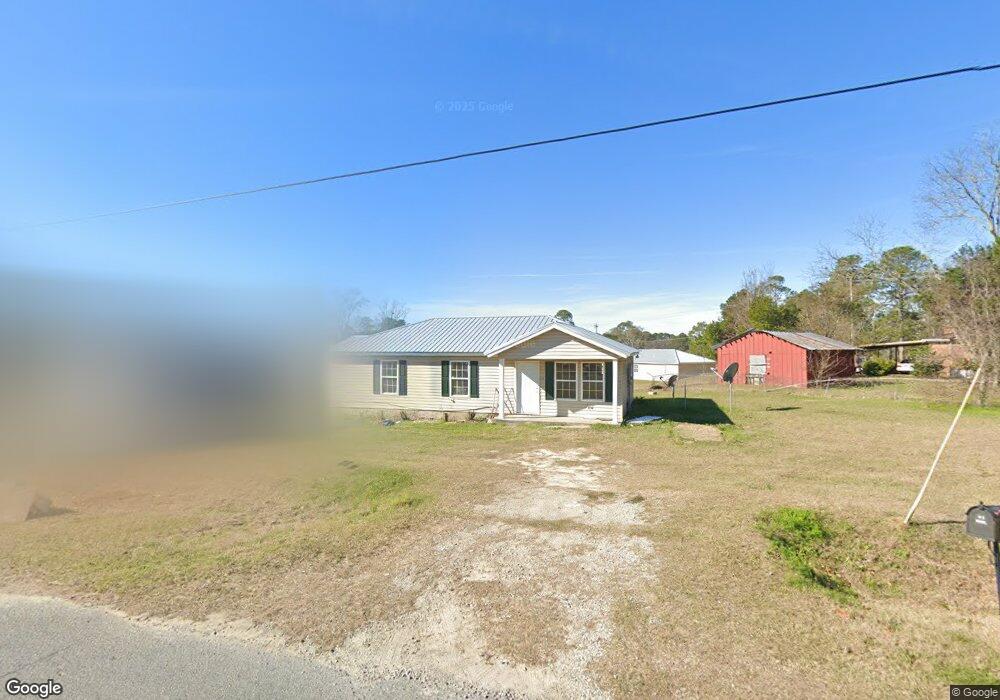
909 N Hickory St Cordele, GA 31015
Estimated Value: $95,667 - $131,000
3
Beds
1
Bath
1,008
Sq Ft
$114/Sq Ft
Est. Value
About This Home
This home is located at 909 N Hickory St, Cordele, GA 31015 and is currently estimated at $114,917, approximately $114 per square foot. 909 N Hickory St is a home located in Crisp County with nearby schools including Crisp County Elementary School, Crisp County Primary School, and Crisp County Middle School.
Ownership History
Date
Name
Owned For
Owner Type
Purchase Details
Closed on
Apr 20, 2017
Sold by
Not Provided
Bought by
Mccadams Robert D
Current Estimated Value
Purchase Details
Closed on
Oct 29, 2014
Sold by
Mccadams Robert D
Bought by
Mccadams Real Estate Llc
Purchase Details
Closed on
Jun 16, 2005
Sold by
Mccadams Robert D
Bought by
Mccadams' Real Estate Llc
Purchase Details
Closed on
Dec 16, 2004
Sold by
Mcadams Robert D
Bought by
Mccadams Real Estate Llc
Purchase Details
Closed on
Feb 16, 2001
Sold by
Central Bank And Trust
Bought by
Mcadams Robert D
Purchase Details
Closed on
Jan 13, 1998
Sold by
Central Bank & Trust
Bought by
Mcadams Robert D
Purchase Details
Closed on
Sep 2, 1997
Sold by
Whitehead Barbara D
Bought by
Central Bank & Trust
Purchase Details
Closed on
May 5, 1995
Sold by
Matejka Jerry
Bought by
Whitehead Barbara D
Purchase Details
Closed on
Jun 11, 1976
Bought by
Matejka Jerry
Create a Home Valuation Report for This Property
The Home Valuation Report is an in-depth analysis detailing your home's value as well as a comparison with similar homes in the area
Home Values in the Area
Average Home Value in this Area
Purchase History
| Date | Buyer | Sale Price | Title Company |
|---|---|---|---|
| Mccadams Robert D | -- | -- | |
| Mccadams Real Estate Llc | -- | -- | |
| Mccadams' Real Estate Llc | -- | -- | |
| Mccadams Real Estate Llc | -- | -- | |
| Mcadams Robert D | $5,000 | -- | |
| Mcadams Robert D | -- | -- | |
| Central Bank & Trust | -- | -- | |
| Whitehead Barbara D | $18,000 | -- | |
| Matejka Jerry | $3,500 | -- |
Source: Public Records
Tax History Compared to Growth
Tax History
| Year | Tax Paid | Tax Assessment Tax Assessment Total Assessment is a certain percentage of the fair market value that is determined by local assessors to be the total taxable value of land and additions on the property. | Land | Improvement |
|---|---|---|---|---|
| 2025 | $930 | $25,960 | $2,778 | $23,182 |
| 2024 | $930 | $30,078 | $2,778 | $27,300 |
| 2023 | $973 | $28,768 | $2,778 | $25,990 |
| 2022 | $687 | $28,015 | $2,778 | $25,237 |
| 2021 | $673 | $26,300 | $2,778 | $23,522 |
| 2020 | $629 | $26,300 | $2,778 | $23,522 |
| 2019 | $746 | $26,300 | $2,778 | $23,522 |
| 2018 | $720 | $24,442 | $2,778 | $21,664 |
| 2017 | $477 | $11,740 | $1,334 | $10,406 |
| 2016 | $347 | $11,740 | $1,334 | $10,406 |
| 2015 | -- | $11,740 | $1,334 | $10,406 |
| 2014 | -- | $11,740 | $1,334 | $10,406 |
| 2013 | -- | $11,740 | $1,334 | $10,406 |
Source: Public Records
Map
Nearby Homes