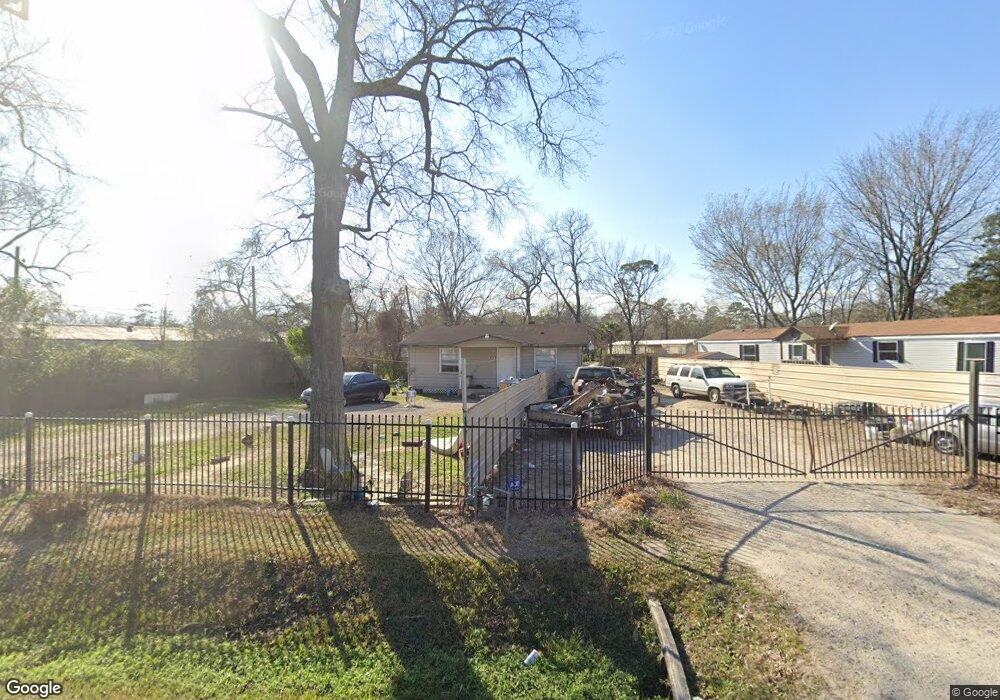
909 Red Bud St Channelview, TX 77530
Estimated Value: $190,000 - $240,000
2
Beds
5
Baths
840
Sq Ft
$249/Sq Ft
Est. Value
About This Home
This home is located at 909 Red Bud St, Channelview, TX 77530 and is currently estimated at $208,815, approximately $248 per square foot. 909 Red Bud St is a home located in Harris County with nearby schools including Channelview High School and Family Christian Academy.
Ownership History
Date
Name
Owned For
Owner Type
Purchase Details
Closed on
Feb 1, 2012
Sold by
Long Term Real Estate Llc
Bought by
Gracia Maricruz Pinon Delariva and Gracia Angel F
Current Estimated Value
Home Financials for this Owner
Home Financials are based on the most recent Mortgage that was taken out on this home.
Original Mortgage
$56,000
Outstanding Balance
$30,494
Interest Rate
3.91%
Mortgage Type
Seller Take Back
Estimated Equity
$178,321
Purchase Details
Closed on
May 2, 2007
Sold by
Weathers Brian Dee and Weathers Jami Leigh
Bought by
Aburto Misael
Home Financials for this Owner
Home Financials are based on the most recent Mortgage that was taken out on this home.
Original Mortgage
$68,400
Interest Rate
6.13%
Mortgage Type
Purchase Money Mortgage
Purchase Details
Closed on
Nov 20, 2002
Sold by
Brewer Robert H
Bought by
Caoey Laura
Purchase Details
Closed on
Jul 2, 1997
Sold by
Brewer B W and Brewer Lois A
Bought by
Brewer Robert H
Create a Home Valuation Report for This Property
The Home Valuation Report is an in-depth analysis detailing your home's value as well as a comparison with similar homes in the area
Home Values in the Area
Average Home Value in this Area
Purchase History
| Date | Buyer | Sale Price | Title Company |
|---|---|---|---|
| Gracia Maricruz Pinon Delariva | -- | None Available | |
| Aburto Misael | -- | Alamo Title Company | |
| Caoey Laura | $10,000 | -- | |
| Brewer Robert H | -- | -- |
Source: Public Records
Mortgage History
| Date | Status | Borrower | Loan Amount |
|---|---|---|---|
| Open | Gracia Maricruz Pinon Delariva | $56,000 | |
| Previous Owner | Aburto Misael | $68,400 |
Source: Public Records
Tax History Compared to Growth
Tax History
| Year | Tax Paid | Tax Assessment Tax Assessment Total Assessment is a certain percentage of the fair market value that is determined by local assessors to be the total taxable value of land and additions on the property. | Land | Improvement |
|---|---|---|---|---|
| 2025 | $3,534 | $186,800 | $85,912 | $100,888 |
| 2024 | $3,534 | $173,305 | $75,173 | $98,132 |
| 2023 | $3,534 | $159,899 | $75,173 | $84,726 |
| 2022 | $3,197 | $137,344 | $64,434 | $72,910 |
| 2021 | $3,031 | $125,103 | $42,956 | $82,147 |
| 2020 | $2,646 | $110,243 | $38,660 | $71,583 |
| 2019 | $2,779 | $106,893 | $38,660 | $68,233 |
| 2018 | $1,273 | $91,200 | $21,478 | $69,722 |
| 2017 | $2,398 | $91,200 | $21,478 | $69,722 |
| 2016 | $1,841 | $70,010 | $16,109 | $53,901 |
| 2015 | $1,779 | $67,000 | $16,109 | $50,891 |
| 2014 | $1,779 | $66,290 | $16,109 | $50,181 |
Source: Public Records
Map
Nearby Homes
- 16134 Palm St
- 0 Laurelwood Dr Unit 43034610
- 1211 Pecan St
- 1109 Becker St
- 16032 1/2 Ridlon St
- 16326 Bear Bayou Dr
- 16023 Ridlon St
- 16219 Bear Bayou 1 2 Dr
- 16600 Laurelwood Dr
- 00 Laurelwood Dr
- 16736 Forest Trail Dr
- 16121 Bear Bayou Dr Unit 13
- 16811 Forest Trail Dr
- 16931 Avenue B
- 16809 Market St
- 108 Cedar Ln
- 16534 Market St
- 16516 Market St
- 17119 Water Oak Dr
- 822 Woodhue St
- 915 Red Bud St
- 919 Red Bud St
- 918 Red Bud St
- 923 Red Bud St
- 924 Red Bud St
- 914 Red Bud St
- 907 Woodland St
- 16267 Palm St
- 16271 Palm St
- 16275 Palm St
- 16263 Palm St
- 16247 Palm St
- 1002 Red Bud St
- 909 Woodland St
- 16239 Palm St
- 902 Woodland St
- 822 Woodland St
- 818 Woodland St
- 16230 Scales St
- 814 Woodland St