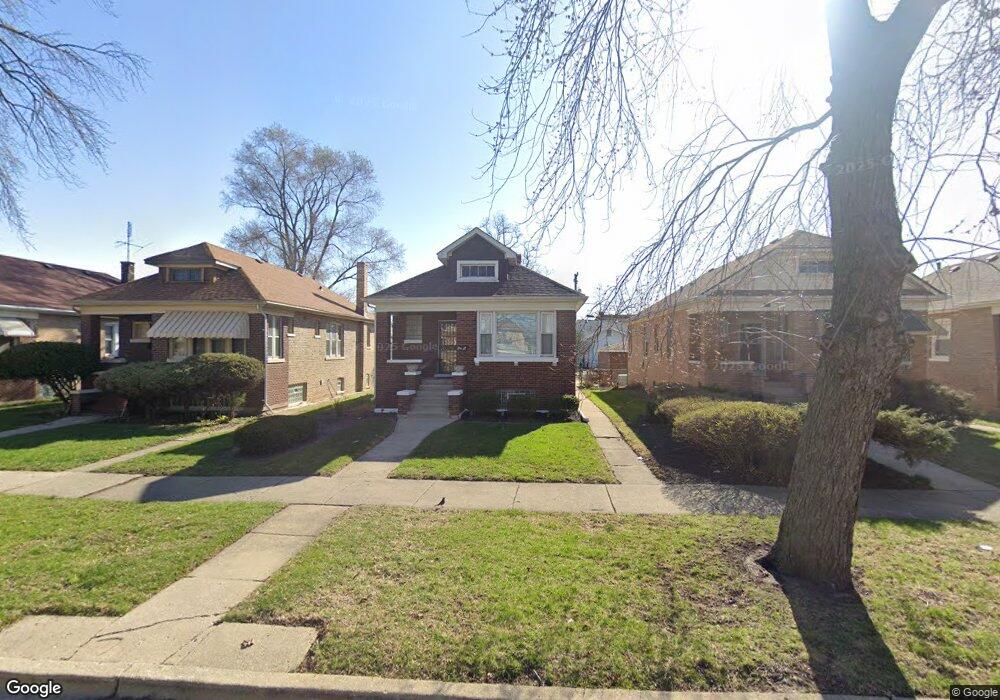
909 S 10th Ave Maywood, IL 60153
Heritage District NeighborhoodEstimated Value: $165,000 - $261,000
3
Beds
1
Bath
987
Sq Ft
$235/Sq Ft
Est. Value
About This Home
This home is located at 909 S 10th Ave, Maywood, IL 60153 and is currently estimated at $231,480, approximately $234 per square foot. 909 S 10th Ave is a home located in Cook County with nearby schools including Emerson Elementary School, Irving Middle School, and Proviso East High School.
Ownership History
Date
Name
Owned For
Owner Type
Purchase Details
Closed on
Jul 11, 2005
Sold by
James Marlene and Collymore Everett H
Bought by
Mccalister Michelle
Current Estimated Value
Home Financials for this Owner
Home Financials are based on the most recent Mortgage that was taken out on this home.
Original Mortgage
$121,250
Outstanding Balance
$63,376
Interest Rate
5.68%
Mortgage Type
Fannie Mae Freddie Mac
Estimated Equity
$168,104
Purchase Details
Closed on
Apr 24, 1996
Sold by
Collymore Hazel H
Bought by
James Marlene and Collymore Everett H
Create a Home Valuation Report for This Property
The Home Valuation Report is an in-depth analysis detailing your home's value as well as a comparison with similar homes in the area
Home Values in the Area
Average Home Value in this Area
Purchase History
| Date | Buyer | Sale Price | Title Company |
|---|---|---|---|
| Mccalister Michelle | $125,000 | Stewart Title Of Illinois | |
| James Marlene | -- | -- |
Source: Public Records
Mortgage History
| Date | Status | Borrower | Loan Amount |
|---|---|---|---|
| Open | Mccalister Michelle | $121,250 |
Source: Public Records
Tax History Compared to Growth
Tax History
| Year | Tax Paid | Tax Assessment Tax Assessment Total Assessment is a certain percentage of the fair market value that is determined by local assessors to be the total taxable value of land and additions on the property. | Land | Improvement |
|---|---|---|---|---|
| 2024 | $6,326 | $18,000 | $2,686 | $15,314 |
| 2023 | $6,075 | $18,000 | $2,686 | $15,314 |
| 2022 | $6,075 | $14,212 | $2,320 | $11,892 |
| 2021 | $6,151 | $14,211 | $2,319 | $11,892 |
| 2020 | $6,122 | $14,211 | $2,319 | $11,892 |
| 2019 | $3,022 | $8,212 | $2,075 | $6,137 |
| 2018 | $2,936 | $8,212 | $2,075 | $6,137 |
| 2017 | $2,873 | $8,212 | $2,075 | $6,137 |
| 2016 | $3,909 | $8,791 | $1,831 | $6,960 |
| 2015 | $3,570 | $8,791 | $1,831 | $6,960 |
| 2014 | $3,294 | $8,791 | $1,831 | $6,960 |
| 2013 | $2,669 | $8,148 | $1,831 | $6,317 |
Source: Public Records
Map
Nearby Homes