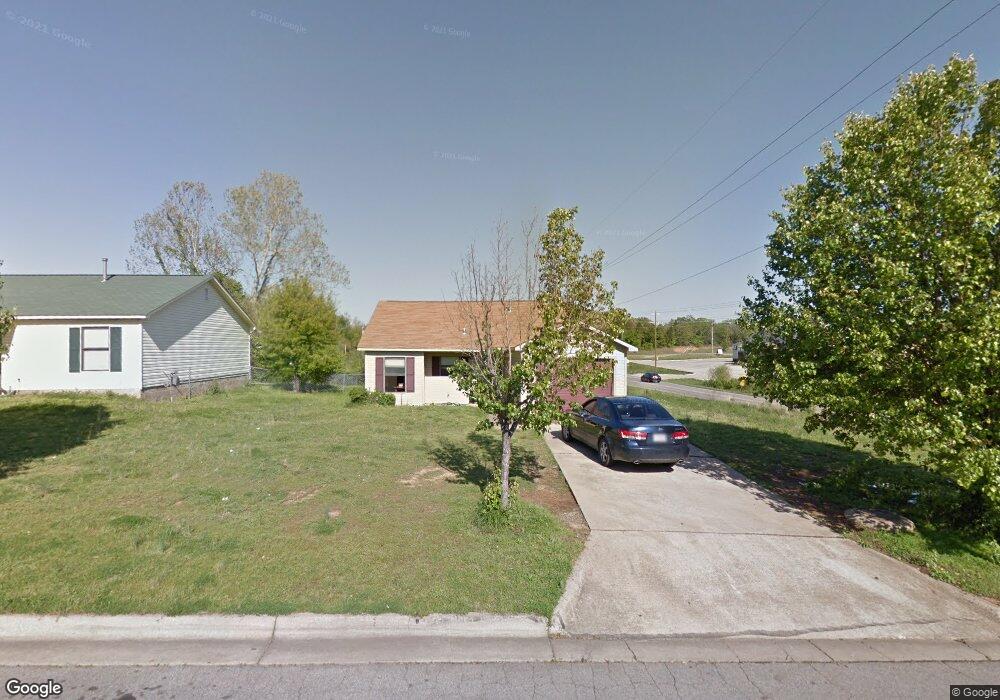
909 S 39th St van Buren, AR 72956
Estimated Value: $135,609 - $148,000
--
Bed
2
Baths
1,120
Sq Ft
$127/Sq Ft
Est. Value
About This Home
This home is located at 909 S 39th St, van Buren, AR 72956 and is currently estimated at $142,152, approximately $126 per square foot. 909 S 39th St is a home located in Crawford County with nearby schools including King Elementary School, Butterfield Trail Middle School, and Van Buren High School.
Ownership History
Date
Name
Owned For
Owner Type
Purchase Details
Closed on
Jun 7, 2023
Sold by
Barlee Properties Ii Limited Partnership
Bought by
Sequoyah Homes Llc and Wines Holdings Arkansas Llc
Current Estimated Value
Purchase Details
Closed on
Jun 3, 2011
Sold by
Barlee Properties Lp
Bought by
Wendlandt Leigh
Home Financials for this Owner
Home Financials are based on the most recent Mortgage that was taken out on this home.
Original Mortgage
$42,400
Interest Rate
4.85%
Mortgage Type
Future Advance Clause Open End Mortgage
Purchase Details
Closed on
May 19, 1995
Bought by
Young-Barlee
Create a Home Valuation Report for This Property
The Home Valuation Report is an in-depth analysis detailing your home's value as well as a comparison with similar homes in the area
Home Values in the Area
Average Home Value in this Area
Purchase History
| Date | Buyer | Sale Price | Title Company |
|---|---|---|---|
| Sequoyah Homes Llc | $1,095,500 | -- | |
| Wendlandt Leigh | $53,000 | -- | |
| Young-Barlee | $70,000 | -- |
Source: Public Records
Mortgage History
| Date | Status | Borrower | Loan Amount |
|---|---|---|---|
| Closed | Wendlandt Leigh | $42,400 |
Source: Public Records
Tax History Compared to Growth
Tax History
| Year | Tax Paid | Tax Assessment Tax Assessment Total Assessment is a certain percentage of the fair market value that is determined by local assessors to be the total taxable value of land and additions on the property. | Land | Improvement |
|---|---|---|---|---|
| 2025 | $816 | $21,000 | $2,200 | $18,800 |
| 2024 | $754 | $21,000 | $2,200 | $18,800 |
| 2023 | $691 | $21,000 | $2,200 | $18,800 |
| 2022 | $628 | $12,100 | $2,200 | $9,900 |
| 2021 | $628 | $12,100 | $2,200 | $9,900 |
| 2020 | $628 | $12,100 | $2,200 | $9,900 |
| 2019 | $628 | $12,100 | $2,200 | $9,900 |
| 2018 | $605 | $12,100 | $2,200 | $9,900 |
| 2017 | $550 | $10,600 | $2,200 | $8,400 |
| 2016 | $550 | $10,600 | $2,200 | $8,400 |
| 2015 | $518 | $10,600 | $2,200 | $8,400 |
| 2014 | $518 | $10,600 | $2,200 | $8,400 |
Source: Public Records
Map
Nearby Homes
- 907 S 39th St
- 905 S 39th St
- 3806 Vinsett Ct
- 1002 Rickey Cir
- 903 S 39th St
- 3804 Vinsett Ct
- 902 S 39th St
- 901 S 39th St
- 1001 Rickey Cir
- 3802 Vinsett Ct
- 1004 Rickey Cir
- 900 S 39th St
- 829 S 39th St
- 903 S 38th St
- 3800 Vinsett Ct
- 1003 Rickey Cir
- 3928 Industrial Park Rd
- 830 S 39th St
- 902 S 40th St
- 1006 Rickey Cir Unit A