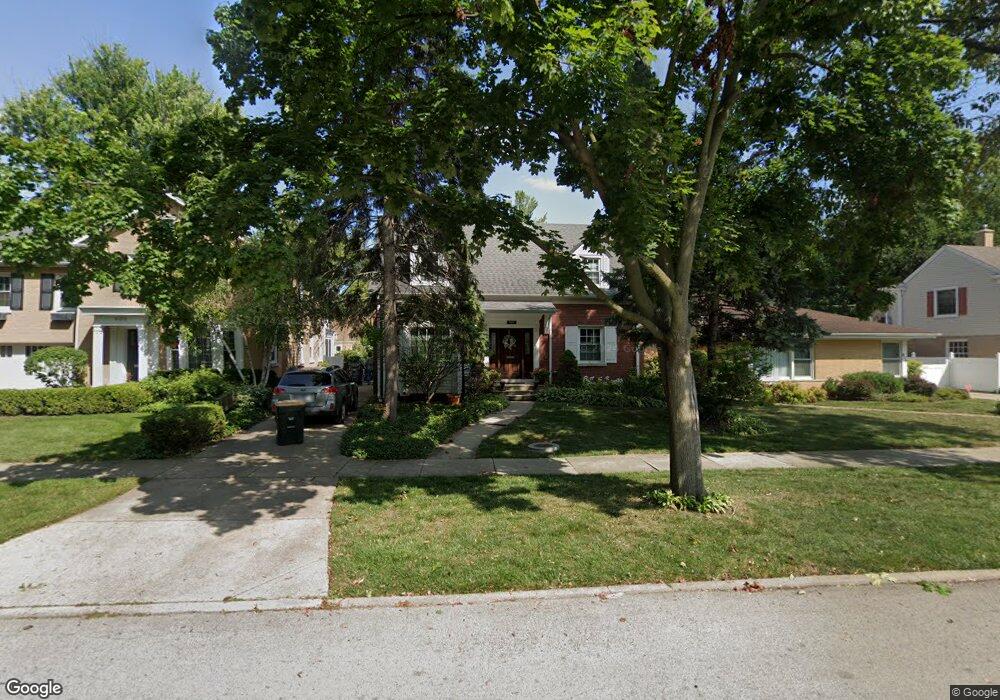
909 S Knight Ave Park Ridge, IL 60068
Estimated Value: $600,000 - $665,000
3
Beds
2
Baths
1,843
Sq Ft
$346/Sq Ft
Est. Value
About This Home
This home is located at 909 S Knight Ave, Park Ridge, IL 60068 and is currently estimated at $638,409, approximately $346 per square foot. 909 S Knight Ave is a home located in Cook County with nearby schools including George Washington Elementary School, Lincoln Middle School, and Maine South High School.
Ownership History
Date
Name
Owned For
Owner Type
Purchase Details
Closed on
Apr 20, 2022
Sold by
Moran Laurene M
Bought by
Provisions Of A Trust and Moran
Current Estimated Value
Purchase Details
Closed on
Sep 17, 2013
Sold by
Moran Laurene M and Moran Owen
Bought by
Moran Laurene M and Moran Owen
Home Financials for this Owner
Home Financials are based on the most recent Mortgage that was taken out on this home.
Original Mortgage
$155,950
Interest Rate
4.58%
Mortgage Type
New Conventional
Purchase Details
Closed on
May 29, 2003
Sold by
Davidiak Madelyn
Bought by
Moran Laurene M
Home Financials for this Owner
Home Financials are based on the most recent Mortgage that was taken out on this home.
Original Mortgage
$190,000
Interest Rate
5.36%
Mortgage Type
Unknown
Purchase Details
Closed on
Jun 14, 1997
Sold by
Davidiak Madelyn
Bought by
Davidiak Madelyn and Trust #2948
Create a Home Valuation Report for This Property
The Home Valuation Report is an in-depth analysis detailing your home's value as well as a comparison with similar homes in the area
Home Values in the Area
Average Home Value in this Area
Purchase History
| Date | Buyer | Sale Price | Title Company |
|---|---|---|---|
| Provisions Of A Trust | -- | Liston Teresa Hoffman | |
| Moran Laurene M | -- | None Available | |
| Moran Laurene M | $445,000 | Atgf Inc | |
| Davidiak Madelyn | -- | -- |
Source: Public Records
Mortgage History
| Date | Status | Borrower | Loan Amount |
|---|---|---|---|
| Previous Owner | Moran Laurene M | $155,950 | |
| Previous Owner | Moran Laurene M | $190,000 |
Source: Public Records
Tax History Compared to Growth
Tax History
| Year | Tax Paid | Tax Assessment Tax Assessment Total Assessment is a certain percentage of the fair market value that is determined by local assessors to be the total taxable value of land and additions on the property. | Land | Improvement |
|---|---|---|---|---|
| 2024 | $11,585 | $46,000 | $11,220 | $34,780 |
| 2023 | $11,073 | $46,000 | $11,220 | $34,780 |
| 2022 | $11,073 | $46,000 | $11,220 | $34,780 |
| 2021 | $12,326 | $43,857 | $6,930 | $36,927 |
| 2020 | $11,903 | $43,857 | $6,930 | $36,927 |
| 2019 | $11,667 | $48,195 | $6,930 | $41,265 |
| 2018 | $10,451 | $39,957 | $5,940 | $34,017 |
| 2017 | $10,424 | $39,957 | $5,940 | $34,017 |
| 2016 | $10,278 | $39,957 | $5,940 | $34,017 |
| 2015 | $10,478 | $36,596 | $4,950 | $31,646 |
| 2014 | $10,288 | $36,596 | $4,950 | $31,646 |
| 2013 | $9,728 | $36,596 | $4,950 | $31,646 |
Source: Public Records
Map
Nearby Homes
- 425 W Talcott Rd
- 929 S Aldine Ave
- 1014 S Chester Ave
- 919 S Chester Ave
- 1016 Arthur St
- 1219 S Western Ave
- 600 S Greenwood Ave
- 516 Engel Blvd
- 1401 Park Ridge Blvd
- 1116 S Cumberland Ave
- 901 S Cumberland Ave
- 820 W Talcott Rd
- 819 Albion Ave
- 428 S Clifton Ave
- 623 S Prospect Ave
- 1610 S Greenwood Ave
- 1425 Brophy Ave
- 1220 Courtland Ave
- 316 S Fairview Ave
- 2300 Windsor Mall Unit 1F
- 905 S Knight Ave
- 913 S Knight Ave
- 901 S Knight Ave
- 917 S Knight Ave
- 910 S Lincoln Ave
- 912 S Lincoln Ave
- 904 S Lincoln Ave
- 923 S Knight Ave
- 916 S Lincoln Ave
- 900 S Lincoln Ave
- 920 S Lincoln Ave
- 908 S Knight Ave
- 925 S Knight Ave
- 914 S Knight Ave
- 900 S Knight Ave
- 833 S Knight Ave
- 918 S Knight Ave
- 924 S Lincoln Ave
- 927 S Knight Ave
- 920 S Knight Ave