909 Sir James Bridge Way Las Vegas, NV 89145
Queensridge NeighborhoodEstimated Value: $670,000 - $1,078,000
3
Beds
3
Baths
2,737
Sq Ft
$341/Sq Ft
Est. Value
About This Home
This home is located at 909 Sir James Bridge Way, Las Vegas, NV 89145 and is currently estimated at $934,612, approximately $341 per square foot. 909 Sir James Bridge Way is a home located in Clark County with nearby schools including John W. Bonner Elementary School, Palo Verde High School, and Faith Lutheran Academy.
Ownership History
Date
Name
Owned For
Owner Type
Purchase Details
Closed on
Jun 23, 2021
Sold by
Hartman Estelle L
Bought by
Hartman Estelle L and Hartman Arthur Scott
Current Estimated Value
Purchase Details
Closed on
Jun 17, 2009
Sold by
Goodman Peter J and Goodman Susan M
Bought by
Hartman Arthur Scott and Hartman Estelle L
Purchase Details
Closed on
Dec 27, 2000
Sold by
Capital Pacific Holdings Llc
Bought by
Goodman Peter J and Goodman Susan M
Home Financials for this Owner
Home Financials are based on the most recent Mortgage that was taken out on this home.
Original Mortgage
$274,500
Interest Rate
7.65%
Create a Home Valuation Report for This Property
The Home Valuation Report is an in-depth analysis detailing your home's value as well as a comparison with similar homes in the area
Home Values in the Area
Average Home Value in this Area
Purchase History
| Date | Buyer | Sale Price | Title Company |
|---|---|---|---|
| Hartman Estelle L | -- | None Available | |
| Hartman Estelle L | -- | None Available | |
| Hartman Arthur Scott | $340,000 | Old Republic Title Company O | |
| Goodman Peter J | $305,000 | Nevada Title Company |
Source: Public Records
Mortgage History
| Date | Status | Borrower | Loan Amount |
|---|---|---|---|
| Previous Owner | Goodman Peter J | $274,500 |
Source: Public Records
Tax History Compared to Growth
Tax History
| Year | Tax Paid | Tax Assessment Tax Assessment Total Assessment is a certain percentage of the fair market value that is determined by local assessors to be the total taxable value of land and additions on the property. | Land | Improvement |
|---|---|---|---|---|
| 2025 | $4,727 | $226,550 | $85,995 | $140,555 |
| 2024 | $4,590 | $226,550 | $85,995 | $140,555 |
| 2023 | $4,590 | $179,826 | $47,250 | $132,576 |
| 2022 | $4,457 | $167,680 | $46,935 | $120,745 |
| 2021 | $4,327 | $157,479 | $41,720 | $115,759 |
| 2020 | $4,198 | $154,115 | $39,200 | $114,915 |
| 2019 | $4,076 | $142,246 | $28,840 | $113,406 |
| 2018 | $3,957 | $137,893 | $28,840 | $109,053 |
| 2017 | $4,381 | $132,623 | $28,840 | $103,783 |
| 2016 | $3,746 | $139,284 | $28,840 | $110,444 |
| 2015 | $3,739 | $109,679 | $23,800 | $85,879 |
| 2014 | $3,630 | $108,190 | $25,200 | $82,990 |
Source: Public Records
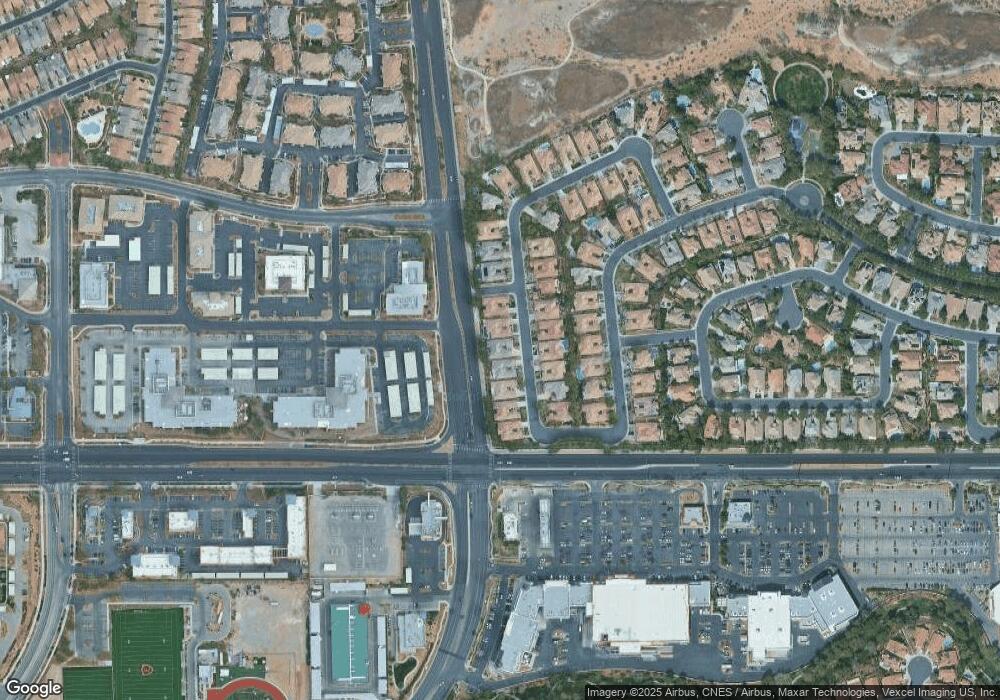
Map
Nearby Homes
- 812 Sir James Bridge Way
- 801 Sir James Bridge Way
- 720 Sir James Bridge Way
- 1001 Meadowleah St
- 10021 Peseo Cresta Ave Unit 7
- 10192 Juniper Creek Ln
- 9721 Camden Hills Ave
- 9812 Via Delores Ave
- 10210 Juniper Creek Ln
- 1325 Chaparral Summit Dr
- 10213 Birch Bluff Ln
- 9717 Winter Palace Dr
- 9704 Camden Hills Ave
- 9733 Trail Rider Dr
- 1401 Goldenspur Ln
- 9625 Gavin Stone Ave
- 9624 Camden Hills Ave
- 10021 Via Toro Ave
- 10005 Bow Ridge Ct
- 10309 Canyon Valley Ave
- 905 Sir James Bridge Way
- 913 Sir James Bridge Way
- 1001 Sir James Bridge Way
- 901 Sir James Bridge Way
- 912 Sir James Bridge Way
- 908 Sir James Bridge Way
- 1000 Sir James Bridge Way
- 904 Sir James Bridge Way
- 1005 Sir James Bridge Way
- 1004 Sir James Bridge Way
- 900 Sir James Bridge Way
- 1009 Sir James Bridge Way
- 1009 Sir James Bridge
- 1009 Sir James Bridge Way
- 949 Granger Farm Way
- 1008 Sir James Bridge Way
- 945 Granger Farm Way
- 1001 Granger Farm Way
- 941 Granger Farm Way