Estimated Value: $245,966 - $262,000
3
Beds
2
Baths
1,638
Sq Ft
$157/Sq Ft
Est. Value
About This Home
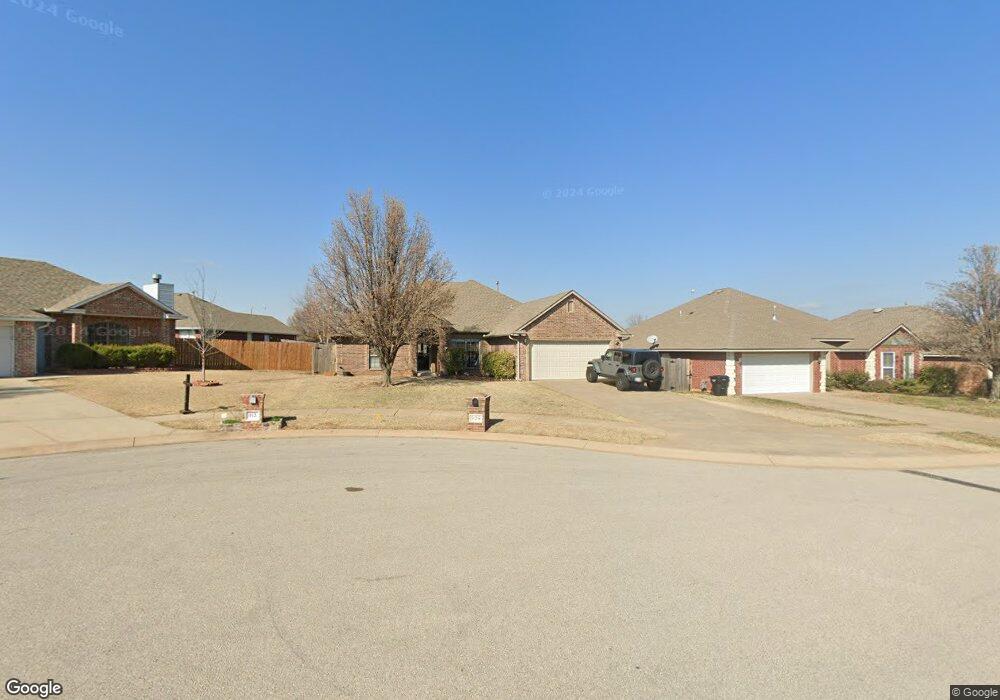
This home is located at 909 SW 40th St, Moore, OK 73160 and is currently estimated at $257,242, approximately $157 per square foot. 909 SW 40th St is a home located in Cleveland County with nearby schools including Broadmoore Elementary School, Highland East Junior High School, and Moore High School.
Ownership History
Date
Name
Owned For
Owner Type
Purchase Details
Closed on
Mar 2, 2010
Sold by
Zimmerman Harold D and Zimmerman Majorie L
Bought by
Walton Billy Richard and Walton Marty A
Current Estimated Value
Home Financials for this Owner
Home Financials are based on the most recent Mortgage that was taken out on this home.
Original Mortgage
$124,489
Outstanding Balance
$82,385
Interest Rate
4.95%
Mortgage Type
FHA
Estimated Equity
$174,857
Purchase Details
Closed on
Sep 11, 2008
Sold by
Ellis Michael A and Ellis Martha J
Bought by
Walton Billy Richard and Zimmerman Harold D
Home Financials for this Owner
Home Financials are based on the most recent Mortgage that was taken out on this home.
Original Mortgage
$119,047
Interest Rate
6.54%
Mortgage Type
FHA
Purchase Details
Closed on
Apr 14, 2005
Sold by
Mongold Kirby and Mongold Christine
Bought by
Ellis Michael A and Ellis Martha J
Purchase Details
Closed on
Jun 23, 2004
Sold by
Russell Jess
Bought by
Mongold Kirby and Mongold Christine
Create a Home Valuation Report for This Property
The Home Valuation Report is an in-depth analysis detailing your home's value as well as a comparison with similar homes in the area
Home Values in the Area
Average Home Value in this Area
Purchase History
| Date | Buyer | Sale Price | Title Company |
|---|---|---|---|
| Walton Billy Richard | -- | Fa | |
| Walton Billy Richard | $140,000 | Lawyers Title Of Ok City Inc | |
| Ellis Michael A | $130,000 | None Available | |
| Mongold Kirby | $20,000 | -- |
Source: Public Records
Mortgage History
| Date | Status | Borrower | Loan Amount |
|---|---|---|---|
| Open | Walton Billy Richard | $124,489 | |
| Closed | Walton Billy Richard | $119,047 |
Source: Public Records
Tax History Compared to Growth
Tax History
| Year | Tax Paid | Tax Assessment Tax Assessment Total Assessment is a certain percentage of the fair market value that is determined by local assessors to be the total taxable value of land and additions on the property. | Land | Improvement |
|---|---|---|---|---|
| 2024 | $2,387 | $20,679 | $3,601 | $17,078 |
| 2023 | $2,325 | $20,077 | $3,683 | $16,394 |
| 2022 | $2,288 | $19,492 | $3,982 | $15,510 |
| 2021 | $2,227 | $18,924 | $4,133 | $14,791 |
| 2020 | $2,159 | $18,373 | $3,362 | $15,011 |
| 2019 | $2,131 | $17,838 | $2,580 | $15,258 |
| 2018 | $2,133 | $17,839 | $2,580 | $15,259 |
| 2017 | $2,141 | $17,839 | $0 | $0 |
| 2016 | $2,089 | $17,293 | $2,501 | $14,792 |
| 2015 | $1,832 | $16,789 | $2,405 | $14,384 |
| 2014 | $1,817 | $16,301 | $1,737 | $14,564 |
Source: Public Records
Map
Nearby Homes
- 905 SW 41st St
- 4300 Mackenzie Dr
- 3701 Kensington Dr
- 708 Carol Ann Place
- 623 SW 37th St
- 4008 Red Apple Cir
- 3624 Green Apple Place
- 813 SW 32nd St
- 4000 Queens Dr
- 805 Brian Ct
- 4412 Brooklyn Ave
- 700 SW 45th St
- 4515 Baldwin Ave
- 104 SE 34th St
- 101 SE 27th St
- 4208 Olde Copper Creek Rd
- 3600 Country Club
- 308 Jeffrey Laird Place
- 3604 Necia St
- 809 SW 27th St
- 905 SW 40th St
- 913 SW 40th St
- 908 SW 39th St
- 904 SW 39th St
- 912 SW 39th St
- 901 SW 40th St
- 917 SW 40th St
- 900 SW 39th St
- 908 SW 40th St
- 904 SW 40th St
- 916 SW 39th St
- 916 SW 40th St
- 4208 Kensington Dr
- 4204 Kensington Dr
- 912 SW 40th St
- 4216 Kensington Dr
- 900 SW 40th St
- 4200 Kensington Dr
- 4220 Kensington Dr
- 845 SW 40th St