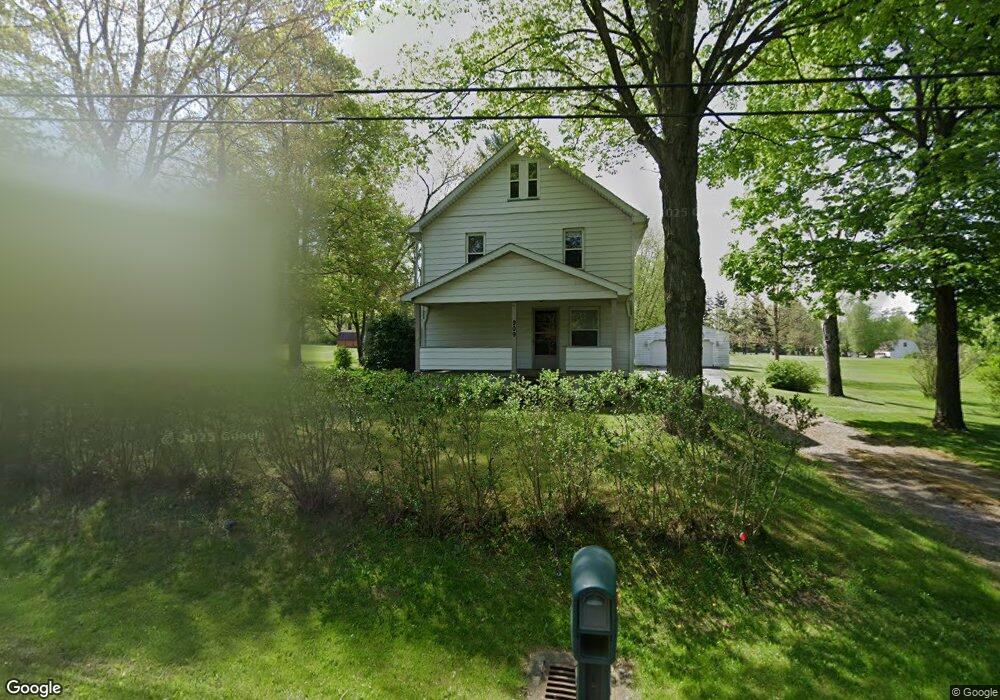
909 Tibbetts Wick Rd Girard, OH 44420
Estimated Value: $181,000 - $201,724
3
Beds
2
Baths
1,536
Sq Ft
$122/Sq Ft
Est. Value
About This Home
This home is located at 909 Tibbetts Wick Rd, Girard, OH 44420 and is currently estimated at $187,931, approximately $122 per square foot. 909 Tibbetts Wick Rd is a home located in Trumbull County with nearby schools including E.J. Blott Elementary School, William S. Guy Middle School, and Liberty High School.
Ownership History
Date
Name
Owned For
Owner Type
Purchase Details
Closed on
Apr 28, 2017
Sold by
Gilles Amy J and Palovich Jennifer
Bought by
Steenberg Rhonda M Van
Current Estimated Value
Purchase Details
Closed on
Feb 15, 2013
Sold by
Bland Charles M
Bought by
Vansteenburg William and Vansteenburg Rhonda M
Purchase Details
Closed on
Feb 25, 2010
Sold by
Bland Manuel
Bought by
Wiesner Rhonda and Vansteenberg William
Purchase Details
Closed on
Jul 7, 2005
Sold by
Blund Josephine
Bought by
Wiesner Rhonda and Vansteenbery William
Purchase Details
Closed on
Apr 28, 2004
Sold by
Bland Thomas R
Bought by
Bland Josephine
Purchase Details
Closed on
Sep 24, 2003
Sold by
Bland Thomas R and Bland Josephine
Bought by
Bland Thomas R and Bland Josephine
Purchase Details
Closed on
Jan 9, 2002
Sold by
Bland Thomas R
Bought by
Bland Josephine
Purchase Details
Closed on
Jan 1, 1990
Bought by
Thomas R
Create a Home Valuation Report for This Property
The Home Valuation Report is an in-depth analysis detailing your home's value as well as a comparison with similar homes in the area
Home Values in the Area
Average Home Value in this Area
Purchase History
| Date | Buyer | Sale Price | Title Company |
|---|---|---|---|
| Steenberg Rhonda M Van | -- | None Available | |
| Vansteenburg William | -- | None Available | |
| Wiesner Rhonda | -- | Attorney | |
| Wiesner Rhonda | $100,000 | -- | |
| Bland Josephine | -- | -- | |
| Bland Thomas R | -- | -- | |
| Bland Josephine | -- | -- | |
| Thomas R | -- | -- |
Source: Public Records
Tax History Compared to Growth
Tax History
| Year | Tax Paid | Tax Assessment Tax Assessment Total Assessment is a certain percentage of the fair market value that is determined by local assessors to be the total taxable value of land and additions on the property. | Land | Improvement |
|---|---|---|---|---|
| 2024 | $2,274 | $43,620 | $6,130 | $37,490 |
| 2023 | $2,274 | $43,620 | $6,130 | $37,490 |
| 2022 | $1,812 | $27,860 | $5,670 | $22,190 |
| 2021 | $1,815 | $27,860 | $5,670 | $22,190 |
| 2020 | $1,819 | $27,860 | $5,670 | $22,190 |
| 2019 | $1,855 | $25,060 | $5,250 | $19,810 |
| 2018 | $1,843 | $25,060 | $5,250 | $19,810 |
| 2017 | $1,793 | $25,060 | $5,250 | $19,810 |
| 2016 | $1,847 | $25,550 | $5,250 | $20,300 |
| 2015 | $1,860 | $25,550 | $5,250 | $20,300 |
| 2014 | $1,842 | $25,550 | $5,250 | $20,300 |
| 2013 | $1,791 | $25,550 | $5,250 | $20,300 |
Source: Public Records
Map
Nearby Homes
- 928 Tibbetts Wick Rd
- 95 Cheyenne Dr
- 1120 Tibbetts Wick Rd
- 1628 Squaw Ct
- 11 Hillside Dr
- 1911 Oriel Rogers Rd
- 2139 Coates Dr
- 2135 Isabelle Dr
- 31 Cherokee Dr
- 634 Goist Ln
- 106 Seneca Dr
- 1104 Gary Ave
- 0 Naylor Lloyd Rd Unit 5066608
- 1085 North Ave
- 2213 N Glenwood Ave
- 943 Dravis St
- 920 Washington Ave
- 843 Lawrence Ave
- 1589 Stillwagon Rd
- 126 Churchill Rd
- 905 Tibbetts Wick Rd
- 915 Tibbetts Wick Rd
- 910 Tibbetts Wick Rd
- 901 Tibbetts Wick Rd
- 917 Tibbetts Wick Rd
- 918 Tibbetts Wick Rd
- 925 Tibbetts Wick Rd
- 899 Tibbetts Wick Rd
- 926 Tibbetts Wick Rd
- 900 Tibbetts Wick Rd
- 906 Tibbetts Wick Rd
- 22 Oriel Rodgers Rd
- 999 Tibbetts Wick Rd
- 935 Tibbetts Wick Rd
- 936 Tibbetts Wick Rd
- 938 Tibbetts Wick Rd
- 392 Thomas Ln
- 394 Thomas Ln
- 888 Tibbetts Wick Rd
- 396 Thomas Ln