Estimated Value: $309,000 - $338,000
--
Bed
3
Baths
2,442
Sq Ft
$133/Sq Ft
Est. Value
About This Home
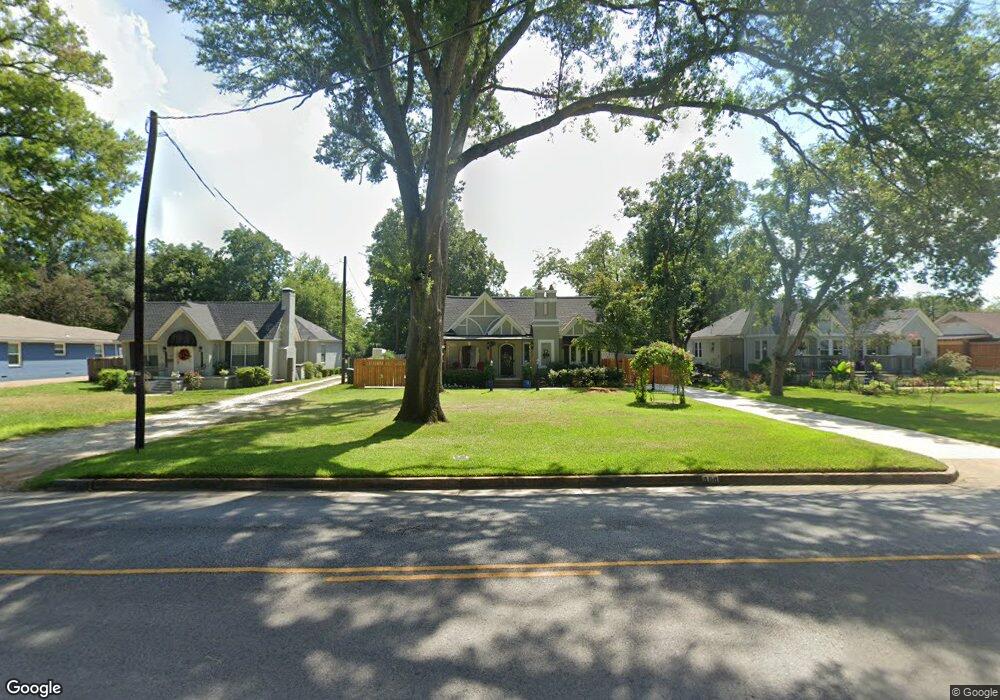
This home is located at 909 Troup Hwy, Tyler, TX 75701 and is currently estimated at $323,893, approximately $132 per square foot. 909 Troup Hwy is a home located in Smith County with nearby schools including Woods Elementary School, Hubbard Middle School, and Tyler Legacy High School.
Ownership History
Date
Name
Owned For
Owner Type
Purchase Details
Closed on
Dec 27, 2010
Sold by
Rieder Thomas A and Rieder Teresa A
Bought by
Blankenship Johnny and Blankenship Jo Nell
Current Estimated Value
Home Financials for this Owner
Home Financials are based on the most recent Mortgage that was taken out on this home.
Original Mortgage
$151,250
Outstanding Balance
$2,288
Interest Rate
4.41%
Mortgage Type
Seller Take Back
Estimated Equity
$321,605
Purchase Details
Closed on
Aug 30, 2005
Sold by
Denson Mitchell Morgan and Denson Melinda
Bought by
George Robin Michelle
Home Financials for this Owner
Home Financials are based on the most recent Mortgage that was taken out on this home.
Original Mortgage
$197,500
Interest Rate
5.81%
Mortgage Type
New Conventional
Create a Home Valuation Report for This Property
The Home Valuation Report is an in-depth analysis detailing your home's value as well as a comparison with similar homes in the area
Home Values in the Area
Average Home Value in this Area
Purchase History
| Date | Buyer | Sale Price | Title Company |
|---|---|---|---|
| Blankenship Johnny | -- | None Available | |
| George Robin Michelle | -- | None Available |
Source: Public Records
Mortgage History
| Date | Status | Borrower | Loan Amount |
|---|---|---|---|
| Open | Blankenship Johnny | $151,250 | |
| Previous Owner | George Robin Michelle | $197,500 |
Source: Public Records
Tax History Compared to Growth
Tax History
| Year | Tax Paid | Tax Assessment Tax Assessment Total Assessment is a certain percentage of the fair market value that is determined by local assessors to be the total taxable value of land and additions on the property. | Land | Improvement |
|---|---|---|---|---|
| 2025 | $1,761 | $338,656 | $60,949 | $277,707 |
| 2024 | $1,761 | $191,448 | $22,319 | $281,381 |
| 2023 | $3,034 | $238,954 | $22,319 | $216,635 |
| 2022 | $3,100 | $172,353 | $14,879 | $157,474 |
| 2021 | $3,018 | $143,838 | $14,879 | $128,959 |
| 2020 | $3,078 | $143,838 | $14,879 | $128,959 |
| 2019 | $3,002 | $137,307 | $11,410 | $125,897 |
| 2018 | $2,826 | $129,958 | $11,410 | $118,548 |
| 2017 | $2,750 | $129,958 | $11,410 | $118,548 |
| 2016 | $2,500 | $117,114 | $11,410 | $105,704 |
| 2015 | $2,083 | $112,620 | $11,410 | $101,210 |
| 2014 | $2,083 | $108,878 | $11,410 | $97,468 |
Source: Public Records
Map
Nearby Homes
- 2319 Pollard Dr
- 2110 Belmont Dr
- 2315 Homestead Ln
- 2215 Homestead Ln
- 2521 Pounds Ave
- 2431 Homestead Ln
- 2210 Homestead Ln
- 1102 S Peach Ave S
- 515 & 517 Charnwood St
- 3922 & 3928 McDonald Rd
- 2313 Dietz Ln
- 1931 S Wiley Ave
- 2413 Dietz Ln
- 2425 Dietz Ln
- 2322 Dietz Ln
- 2108 S Wall Ave
- 2410 Dietz Ln
- 2438 Dietz Ln
- 2026 S Wall Ave
- 904 E Dulse St
- 905 Troup Hwy
- 915 Troup Hwy
- 921 Troup Hwy
- 921 Troup Hwy
- 2204 2204 Pollard
- 2204 Pollard Dr
- 2210 Pollard Dr
- 925 Troup Hwy
- 2220 Pollard Dr
- 1001 Troup Hwy
- 914 Troup Hwy
- 910 Troup Hwy
- 910 910 Troup Hwy
- 2300 Pollard Dr
- 815 Troup Hwy
- 2300 2300 Pollard
- 2225 Pollard Dr
- 930 Troup Hwy
- 820 Troup Hwy
- 932 932 Troup Hwy