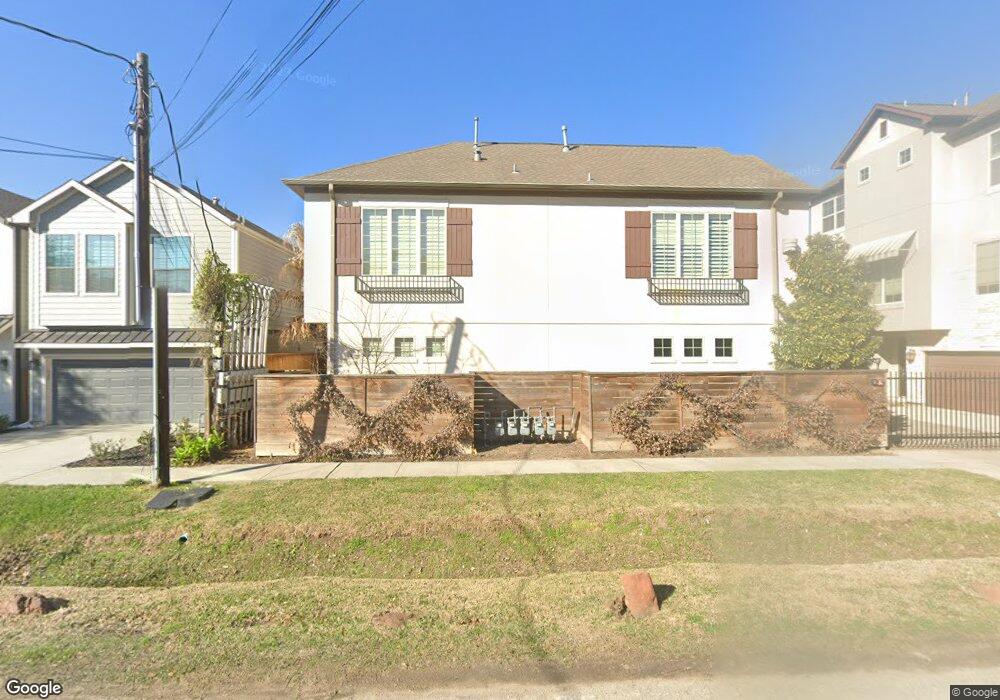
909 W 22nd St Unit D Houston, TX 77008
Greater Heights NeighborhoodEstimated Value: $366,367 - $420,000
3
Beds
2
Baths
1,566
Sq Ft
$257/Sq Ft
Est. Value
About This Home
This home is located at 909 W 22nd St Unit D, Houston, TX 77008 and is currently estimated at $402,092, approximately $256 per square foot. 909 W 22nd St Unit D is a home located in Harris County with nearby schools including Sinclair Elementary School, Hamilton Middle, and Waltrip High School.
Ownership History
Date
Name
Owned For
Owner Type
Purchase Details
Closed on
May 3, 2019
Sold by
Boehm Matthew and Hunter Lisa Michelle
Bought by
Verm Rachel M
Current Estimated Value
Home Financials for this Owner
Home Financials are based on the most recent Mortgage that was taken out on this home.
Original Mortgage
$264,000
Outstanding Balance
$231,162
Interest Rate
4%
Mortgage Type
New Conventional
Estimated Equity
$170,930
Purchase Details
Closed on
Feb 13, 2015
Sold by
Steinke Lauren Ivers and Steinke Bradley
Bought by
Boehm Matthew
Home Financials for this Owner
Home Financials are based on the most recent Mortgage that was taken out on this home.
Original Mortgage
$215,000
Interest Rate
3.78%
Mortgage Type
New Conventional
Purchase Details
Closed on
Dec 10, 2008
Sold by
Hhn Homes Lp
Bought by
Ratcliffivers Lauren
Home Financials for this Owner
Home Financials are based on the most recent Mortgage that was taken out on this home.
Original Mortgage
$233,731
Interest Rate
6.19%
Mortgage Type
FHA
Create a Home Valuation Report for This Property
The Home Valuation Report is an in-depth analysis detailing your home's value as well as a comparison with similar homes in the area
Home Values in the Area
Average Home Value in this Area
Purchase History
| Date | Buyer | Sale Price | Title Company |
|---|---|---|---|
| Verm Rachel M | -- | Chicago Title Company | |
| Boehm Matthew | -- | None Available | |
| Ratcliffivers Lauren | -- | Fidelity National Tide Upper |
Source: Public Records
Mortgage History
| Date | Status | Borrower | Loan Amount |
|---|---|---|---|
| Open | Verm Rachel M | $264,000 | |
| Previous Owner | Boehm Matthew | $215,000 | |
| Previous Owner | Ratcliffivers Lauren | $233,731 |
Source: Public Records
Tax History Compared to Growth
Tax History
| Year | Tax Paid | Tax Assessment Tax Assessment Total Assessment is a certain percentage of the fair market value that is determined by local assessors to be the total taxable value of land and additions on the property. | Land | Improvement |
|---|---|---|---|---|
| 2025 | $5,147 | $366,990 | $123,970 | $243,020 |
| 2024 | $5,147 | $358,766 | $123,970 | $234,796 |
| 2023 | $5,147 | $350,093 | $97,405 | $252,688 |
| 2022 | $6,989 | $317,417 | $79,695 | $237,722 |
| 2021 | $6,735 | $288,969 | $79,695 | $209,274 |
| 2020 | $7,261 | $299,826 | $102,807 | $197,019 |
| 2019 | $7,387 | $291,919 | $102,807 | $189,112 |
| 2018 | $5,637 | $291,919 | $102,807 | $189,112 |
| 2017 | $7,381 | $291,919 | $79,695 | $212,224 |
| 2016 | $8,499 | $336,132 | $92,446 | $243,686 |
| 2015 | $5,374 | $336,132 | $92,446 | $243,686 |
| 2014 | $5,374 | $301,490 | $82,174 | $219,316 |
Source: Public Records
Map
Nearby Homes
- 919 W 23rd St
- 931 W 23rd St Unit K
- 931 W 23rd St Unit B
- 816 W 23rd St
- 940 W 24th St
- 953 W 23rd St
- 823 W 21st St
- 934 W 24th St
- 0 W 21st St
- 912B W 21st St
- 912A W 21st St
- 937 W 21st St
- 908 W 21st St
- 910A W 21st St
- 910B W 21st St
- 1009 W 23rd St
- 2121 N Durham Dr
- 1002 W 22nd St
- 1012 W 23rd St
- 1011 W 23rd St
- 909 W 22nd St Unit E
- 909 W 22nd St Unit B
- 909 W 22nd St Unit A
- 909 W 22nd St Unit G
- 909 W 22nd St Unit F
- 909 W 22nd St Unit I
- 909 W 22nd St Unit H
- 909 W 22nd St Unit J
- 909 W 22nd St Unit K
- 909 W 22nd St Unit M
- 909 W 22nd St Unit N
- 909 W 22nd St Unit C
- 909 W 22nd St Unit L
- 909 W 22nd St
- 905D W 22nd St
- 905E W 22nd St
- 905C W 22nd St
- 905A W 22nd St
- 905B W 22nd St
- 905 W 22nd St Unit D