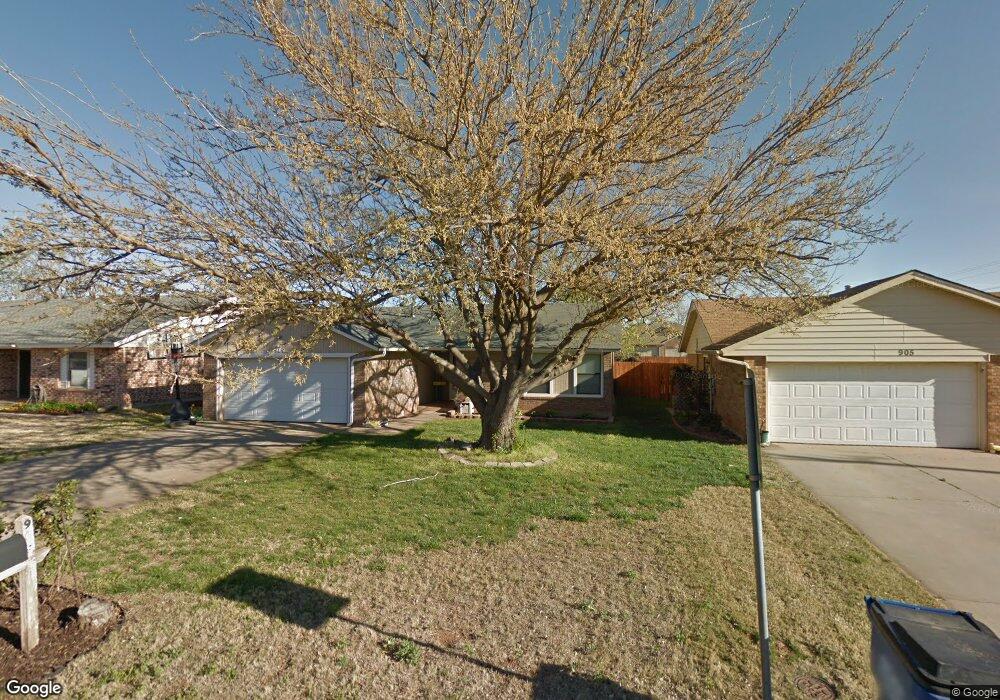
909 W Kyle Way Mustang, OK 73064
Estimated Value: $169,523 - $186,000
3
Beds
2
Baths
1,105
Sq Ft
$160/Sq Ft
Est. Value
About This Home
This home is located at 909 W Kyle Way, Mustang, OK 73064 and is currently estimated at $177,131, approximately $160 per square foot. 909 W Kyle Way is a home located in Canadian County with nearby schools including Mustang Lakehoma Elementary School, Mustang Horizon Intermediate School, and Mustang Middle School.
Ownership History
Date
Name
Owned For
Owner Type
Purchase Details
Closed on
Mar 28, 2008
Sold by
Mabry Travis M and Mabry Tiffiny N
Bought by
Mabry Travis M and Mabry Tiffiny N
Current Estimated Value
Home Financials for this Owner
Home Financials are based on the most recent Mortgage that was taken out on this home.
Original Mortgage
$85,260
Outstanding Balance
$54,402
Interest Rate
6.11%
Mortgage Type
FHA
Estimated Equity
$122,729
Purchase Details
Closed on
Oct 31, 2002
Sold by
Owen Justin D and Owen Amanda R
Home Financials for this Owner
Home Financials are based on the most recent Mortgage that was taken out on this home.
Original Mortgage
$78,876
Interest Rate
6.01%
Purchase Details
Closed on
Oct 30, 1998
Sold by
Owen Justin D
Purchase Details
Closed on
Jul 1, 1998
Sold by
Drewry Billy
Purchase Details
Closed on
Oct 17, 1997
Sold by
Drewry Christina
Purchase Details
Closed on
Apr 29, 1993
Sold by
Smith Smith M and Smith Libby G
Create a Home Valuation Report for This Property
The Home Valuation Report is an in-depth analysis detailing your home's value as well as a comparison with similar homes in the area
Home Values in the Area
Average Home Value in this Area
Purchase History
| Date | Buyer | Sale Price | Title Company |
|---|---|---|---|
| Mabry Travis M | -- | None Available | |
| -- | $79,500 | -- | |
| -- | -- | -- | |
| -- | $60,000 | -- | |
| -- | -- | -- | |
| -- | $41,500 | -- |
Source: Public Records
Mortgage History
| Date | Status | Borrower | Loan Amount |
|---|---|---|---|
| Open | Mabry Travis M | $85,260 | |
| Closed | -- | $78,876 |
Source: Public Records
Tax History Compared to Growth
Tax History
| Year | Tax Paid | Tax Assessment Tax Assessment Total Assessment is a certain percentage of the fair market value that is determined by local assessors to be the total taxable value of land and additions on the property. | Land | Improvement |
|---|---|---|---|---|
| 2024 | $1,109 | $12,477 | $1,620 | $10,857 |
| 2023 | $1,109 | $12,114 | $1,620 | $10,494 |
| 2022 | $1,087 | $11,761 | $1,620 | $10,141 |
| 2021 | $1,056 | $11,419 | $1,620 | $9,799 |
| 2020 | $1,029 | $11,086 | $1,620 | $9,466 |
| 2019 | $1,003 | $10,828 | $1,620 | $9,208 |
| 2018 | $1,053 | $11,107 | $1,620 | $9,487 |
| 2017 | $1,008 | $10,783 | $1,620 | $9,163 |
| 2016 | $978 | $10,783 | $1,620 | $9,163 |
| 2015 | $949 | $10,164 | $1,620 | $8,544 |
| 2014 | $949 | $10,140 | $1,200 | $8,940 |
Source: Public Records
Map
Nearby Homes
- 608 N Remington Way
- 508 N Caddell Way
- 1005 W Ridgehaven Way
- 601 N Chisholm Trail Way
- 1035 W Windsor Way
- 900 W Nandina Way
- 1208 W Flowering Peach Way
- 1250 N Tea Olive Way
- 513 N Shannon Way
- 1408 N Golden Bell Way
- 1308 W Harvard Way
- 313 N Shannon Way
- 628 W Alamo Court Way
- 1316 W Harvard Way
- 602 W Shadow Ridge Way
- 531 W Shadow Ridge Way
- 400 N Amethyst Way
- 1401 W Harvard Way
- 913 N Centennial Way
- 401 N Topaz Way
- 913 W Kyle Way
- 905 W Kyle Way
- 910 W Prairie Wind Way
- 910 W Kyle Way
- 914 W Kyle Way
- 914 W Prairie Wind Way
- 906 W Kyle Way
- 921 W Kyle Way
- 918 W Kyle Way
- 918 W Prairie Wind Way
- 909 W Prairie Wind Way
- 922 W Kyle Way
- 0 N Czech Hall Rd
- 925 W Kyle Way
- 913 W Prairie Wind Way
- 713 N Remington Way
- 709 N Remington Way
- 926 W Kyle Way
- 801 N Remington Way