Estimated Value: $408,000 - $804,000
4
Beds
3
Baths
3,978
Sq Ft
$147/Sq Ft
Est. Value
About This Home
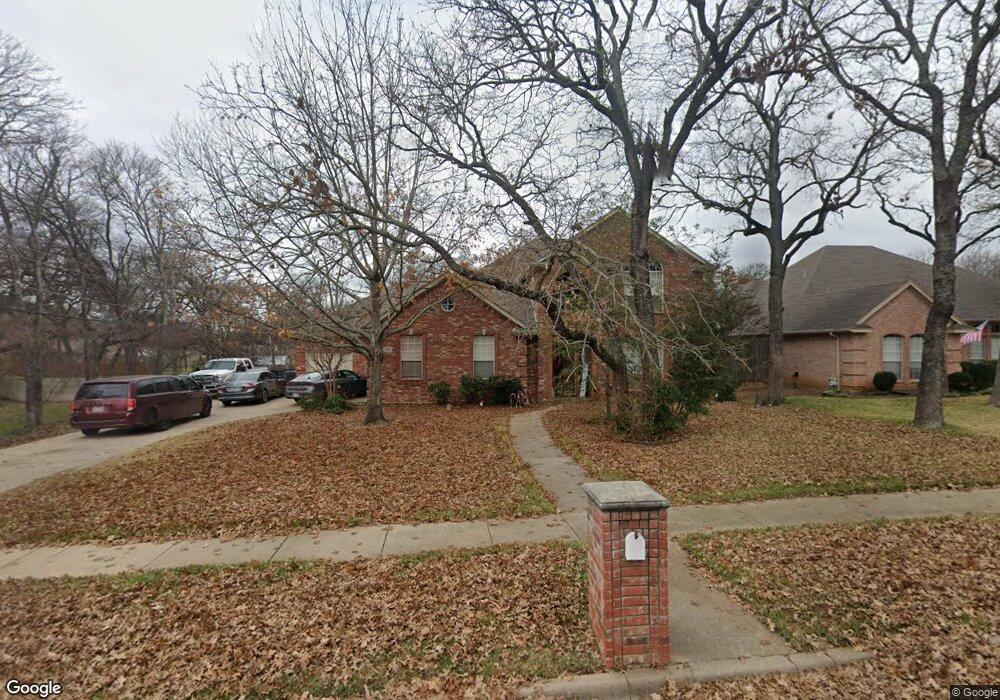
This home is located at 909 W Redbud Dr, Hurst, TX 76053 and is currently estimated at $584,961, approximately $147 per square foot. 909 W Redbud Dr is a home located in Tarrant County with nearby schools including Hurst Hills Elementary School, Hurst J High School, and L.D. Bell High School.
Ownership History
Date
Name
Owned For
Owner Type
Purchase Details
Closed on
Jul 3, 2012
Sold by
Shami Victor S and Shami Gloria Kemp
Bought by
Polley Michael L and Polley Elissa C
Current Estimated Value
Home Financials for this Owner
Home Financials are based on the most recent Mortgage that was taken out on this home.
Original Mortgage
$252,000
Outstanding Balance
$39,041
Interest Rate
3.81%
Mortgage Type
New Conventional
Estimated Equity
$545,920
Purchase Details
Closed on
Feb 9, 1996
Sold by
Stinson Development Corp
Bought by
Walsh David B and Walsh Annette A
Home Financials for this Owner
Home Financials are based on the most recent Mortgage that was taken out on this home.
Original Mortgage
$20,000
Interest Rate
7.04%
Create a Home Valuation Report for This Property
The Home Valuation Report is an in-depth analysis detailing your home's value as well as a comparison with similar homes in the area
Home Values in the Area
Average Home Value in this Area
Purchase History
| Date | Buyer | Sale Price | Title Company |
|---|---|---|---|
| Polley Michael L | -- | None Available | |
| Walsh David B | -- | Safeco Land Title |
Source: Public Records
Mortgage History
| Date | Status | Borrower | Loan Amount |
|---|---|---|---|
| Open | Polley Michael L | $252,000 | |
| Previous Owner | Walsh David B | $20,000 |
Source: Public Records
Tax History Compared to Growth
Tax History
| Year | Tax Paid | Tax Assessment Tax Assessment Total Assessment is a certain percentage of the fair market value that is determined by local assessors to be the total taxable value of land and additions on the property. | Land | Improvement |
|---|---|---|---|---|
| 2025 | $7,336 | $499,000 | $83,852 | $415,148 |
| 2024 | $7,336 | $530,353 | $83,852 | $446,501 |
| 2023 | $8,813 | $537,000 | $69,082 | $467,918 |
| 2022 | $9,207 | $399,886 | $69,175 | $330,711 |
| 2021 | $9,644 | $399,886 | $60,000 | $339,886 |
| 2020 | $9,263 | $385,000 | $53,593 | $331,407 |
| 2019 | $9,423 | $385,000 | $50,000 | $335,000 |
| 2018 | $7,799 | $350,900 | $35,000 | $315,900 |
| 2017 | $8,072 | $384,156 | $35,000 | $349,156 |
| 2016 | $7,339 | $290,000 | $35,000 | $255,000 |
| 2015 | $6,573 | $273,800 | $27,500 | $246,300 |
| 2014 | $6,573 | $273,800 | $27,500 | $246,300 |
Source: Public Records
Map
Nearby Homes
- 512 Billie Ruth Ln
- 405 Billy Creek Cir
- 425 Moore Creek Rd
- 808 Betty Ct
- 649 Timberline Dr
- 632 Melbourne Ct
- 741 Ponderosa Dr
- 1200 Walker Dr
- 1112 Blakey Ct
- 758 Briarwood Ln
- 756 Briarwood Ln
- 425 Ridgecrest Dr
- 1304 W Redbud Dr
- 744 Briarwood Ln
- 637 Post Oak Dr
- 228 Arcadia St
- 913 Zelda Dr
- 916 Zelda Dr
- 829 Joanna Dr
- 628 Elm St
- 913 W Redbud Dr
- 429 Englewood Ln
- 917 W Redbud Dr
- 425 Englewood Ln
- 433 Englewood Ln
- 421 Englewood Ln
- 908 W Redbud Dr
- 921 W Redbud Dr
- 912 W Redbud Dr
- 904 W Redbud Dr
- 417 Englewood Ln
- 916 W Redbud Dr
- 501 Englewood Ln
- 925 W Redbud Dr
- 432 Englewood Ln
- 428 Englewood Ln
- 413 Englewood Ln
- 424 Englewood Ln
- 920 W Redbud Dr
- 909 Oakwood Ave