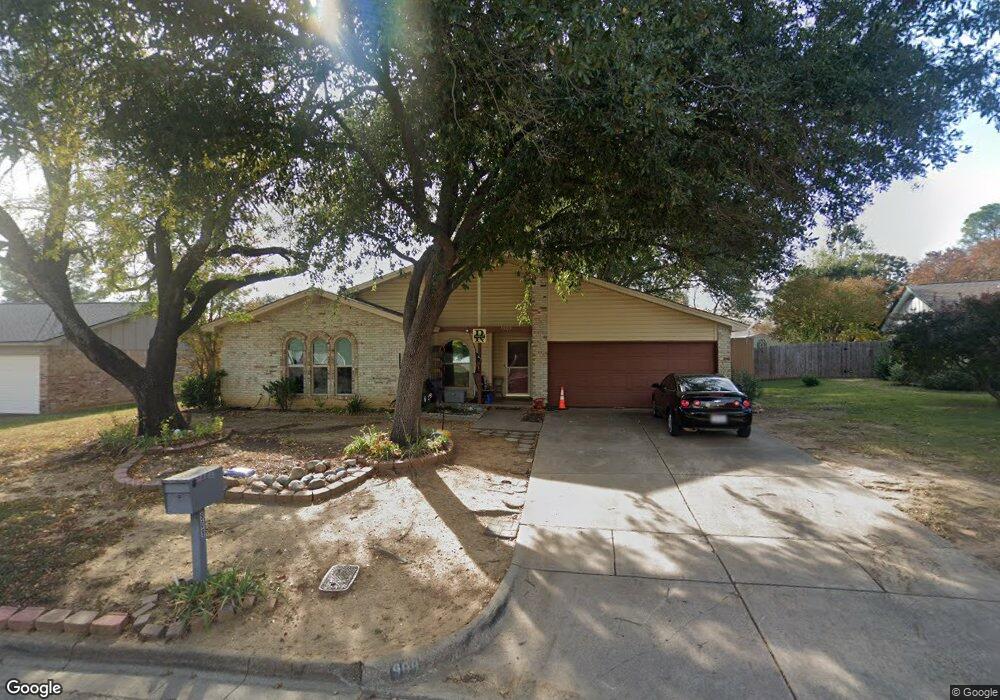
909 Warwick St Bedford, TX 76022
Estimated Value: $318,000 - $337,000
3
Beds
2
Baths
1,464
Sq Ft
$225/Sq Ft
Est. Value
About This Home
This home is located at 909 Warwick St, Bedford, TX 76022 and is currently estimated at $329,559, approximately $225 per square foot. 909 Warwick St is a home located in Tarrant County with nearby schools including Bell Manor Elementary School, Central J High School, and Trinity High School.
Ownership History
Date
Name
Owned For
Owner Type
Purchase Details
Closed on
Feb 23, 2007
Sold by
Dollar Tim and Dollar Adriana
Bought by
Rodriguez Dennis and Rodriguez Nadine Louise
Current Estimated Value
Home Financials for this Owner
Home Financials are based on the most recent Mortgage that was taken out on this home.
Original Mortgage
$133,900
Outstanding Balance
$80,423
Interest Rate
6.21%
Mortgage Type
Purchase Money Mortgage
Estimated Equity
$249,136
Purchase Details
Closed on
Feb 7, 2003
Sold by
Moyer Daniel and Moyer Julie
Bought by
Dollar Tim and Dollar Adriana
Home Financials for this Owner
Home Financials are based on the most recent Mortgage that was taken out on this home.
Original Mortgage
$109,800
Interest Rate
5.9%
Purchase Details
Closed on
Oct 14, 1993
Sold by
Spencer James Douglas and Spencer Diane Kay
Bought by
Dollar Tim and Dollar Adriana
Home Financials for this Owner
Home Financials are based on the most recent Mortgage that was taken out on this home.
Original Mortgage
$86,932
Interest Rate
6.87%
Mortgage Type
FHA
Create a Home Valuation Report for This Property
The Home Valuation Report is an in-depth analysis detailing your home's value as well as a comparison with similar homes in the area
Home Values in the Area
Average Home Value in this Area
Purchase History
| Date | Buyer | Sale Price | Title Company |
|---|---|---|---|
| Rodriguez Dennis | -- | None Available | |
| Dollar Tim | -- | -- | |
| Dollar Tim | -- | Safeco Land Title Co |
Source: Public Records
Mortgage History
| Date | Status | Borrower | Loan Amount |
|---|---|---|---|
| Open | Rodriguez Dennis | $133,900 | |
| Previous Owner | Dollar Tim | $109,800 | |
| Previous Owner | Dollar Tim | $86,932 |
Source: Public Records
Tax History Compared to Growth
Tax History
| Year | Tax Paid | Tax Assessment Tax Assessment Total Assessment is a certain percentage of the fair market value that is determined by local assessors to be the total taxable value of land and additions on the property. | Land | Improvement |
|---|---|---|---|---|
| 2025 | $3,227 | $233,688 | $65,000 | $168,688 |
| 2024 | $3,227 | $233,688 | $65,000 | $168,688 |
| 2023 | $2,903 | $245,096 | $45,000 | $200,096 |
| 2022 | $4,096 | $187,524 | $45,000 | $142,524 |
| 2021 | $4,152 | $176,253 | $45,000 | $131,253 |
| 2020 | $4,679 | $196,777 | $45,000 | $151,777 |
| 2019 | $4,497 | $197,998 | $45,000 | $152,998 |
| 2018 | $3,706 | $168,275 | $25,000 | $143,275 |
| 2017 | $3,701 | $152,977 | $25,000 | $127,977 |
| 2016 | $3,528 | $145,833 | $25,000 | $120,833 |
| 2015 | $2,796 | $141,008 | $24,000 | $117,008 |
| 2014 | $2,796 | $122,300 | $18,000 | $104,300 |
Source: Public Records
Map
Nearby Homes
- 828 Gregory Ave
- 2420 Dalewood Ln
- 800 Prestwick St
- 808 Gregory Ave
- 1049 Stableway Ln
- 2620 Britany Cir
- 2101 Gettysburg Place
- 2428 Chestnut Way
- 2024 Charleston Dr
- 1116 Highpoint Rd
- 2504 Westpark Way Cir
- 1213 Greendale Dr
- 1216 Princeton Place
- 2303 Mcmullin Dr
- 2421 Creek Villas Dr
- 2201 Greendale Ct
- 804 Natchez Ave
- 952 Charleston Dr
- 2025 Schumac Ln
- 933 Charleston Ct
- 905 Warwick St
- 913 Warwick St
- 2304 Warwick Ct
- 901 Warwick St
- 917 Warwick St
- 916 Warwick St
- 2308 Warwick Ct
- 904 Prestwick St
- 920 Warwick St
- 908 Prestwick St
- 900 Prestwick St
- 912 Warwick St
- 912 Warwick St
- 912 Prestwick St
- 828 Prestwick St
- 828 Prestwick St Unit 1
- 921 Warwick St
- 2305 Warwick Ct
- 924 Warwick St
- 916 Prestwick St