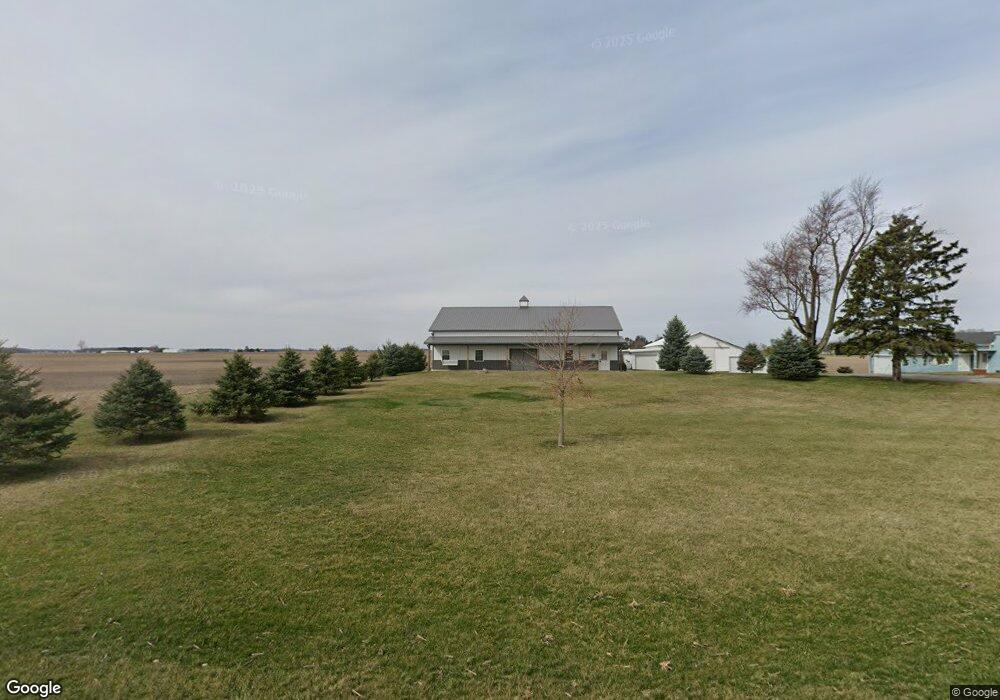
9092 Road 3 Leipsic, OH 45856
Estimated Value: $232,000 - $275,000
Studio
1
Bath
1,643
Sq Ft
$158/Sq Ft
Est. Value
About This Home
This home is located at 9092 Road 3, Leipsic, OH 45856 and is currently estimated at $259,774, approximately $158 per square foot. 9092 Road 3 is a home located in Putnam County with nearby schools including Pandora-Gilboa Elementary School, Pandora-Gilboa Middle School, and Pandora-Gilboa High School.
Ownership History
Date
Name
Owned For
Owner Type
Purchase Details
Closed on
May 24, 2019
Sold by
Meyer Joshua T
Bought by
Schnipke Jacob John
Current Estimated Value
Home Financials for this Owner
Home Financials are based on the most recent Mortgage that was taken out on this home.
Original Mortgage
$159,750
Outstanding Balance
$100,629
Interest Rate
4.1%
Mortgage Type
New Conventional
Estimated Equity
$159,145
Purchase Details
Closed on
Nov 18, 2010
Sold by
Meyer Kenneth T and Meyer Linda E
Bought by
Meyer Joshua T
Home Financials for this Owner
Home Financials are based on the most recent Mortgage that was taken out on this home.
Original Mortgage
$96,000
Interest Rate
4.27%
Mortgage Type
Future Advance Clause Open End Mortgage
Purchase Details
Closed on
Dec 11, 2003
Sold by
Hicks Jane Arlene
Bought by
Meyer Kenneth T and Meyer Lynda E
Create a Home Valuation Report for This Property
The Home Valuation Report is an in-depth analysis detailing your home's value as well as a comparison with similar homes in the area
Purchase History
| Date | Buyer | Sale Price | Title Company |
|---|---|---|---|
| Schnipke Jacob John | $177,500 | None Available | |
| Meyer Joshua T | $95,000 | None Available | |
| Meyer Kenneth T | $128,000 | None Available |
Source: Public Records
Mortgage History
| Date | Status | Borrower | Loan Amount |
|---|---|---|---|
| Open | Schnipke Jacob John | $159,750 | |
| Previous Owner | Meyer Joshua T | $96,000 |
Source: Public Records
Tax History
| Year | Tax Paid | Tax Assessment Tax Assessment Total Assessment is a certain percentage of the fair market value that is determined by local assessors to be the total taxable value of land and additions on the property. | Land | Improvement |
|---|---|---|---|---|
| 2025 | $2,255 | $75,800 | $8,440 | $67,360 |
| 2024 | $2,114 | $75,800 | $8,440 | $67,360 |
| 2023 | $2,283 | $51,090 | $6,280 | $44,810 |
| 2022 | $2,024 | $51,090 | $6,279 | $44,811 |
| 2021 | $1,914 | $48,180 | $6,280 | $41,900 |
| 2020 | $1,931 | $40,140 | $5,310 | $34,830 |
| 2019 | $1,647 | $42,660 | $6,280 | $36,380 |
| 2018 | $1,559 | $42,660 | $6,280 | $36,380 |
| 2017 | $1,336 | $42,660 | $6,280 | $36,380 |
| 2016 | $1,336 | $40,140 | $5,310 | $34,830 |
| 2015 | $1,330 | $40,140 | $5,310 | $34,830 |
| 2014 | $999 | $30,970 | $5,310 | $25,660 |
| 2013 | $1,015 | $30,970 | $5,310 | $25,660 |
Source: Public Records
Map
Nearby Homes
- 1280 Ohio 613
- 5666 State Route 224
- 358 State Route 613
- 634 Ohio St
- 504 E Main St
- 356 S Belmore St
- 303 S Poplar St
- 713 State St
- 709 State St
- 712 State St
- 707 State St
- 703 State St
- 705 State St
- 711 State St
- 25 W Main St
- 13 E Liberty St
- 331 Chippewa Dr
- 208 W Main St
- 209 W Broadway St
- 3111 Township Road 93
Your Personal Tour Guide
Ask me questions while you tour the home.