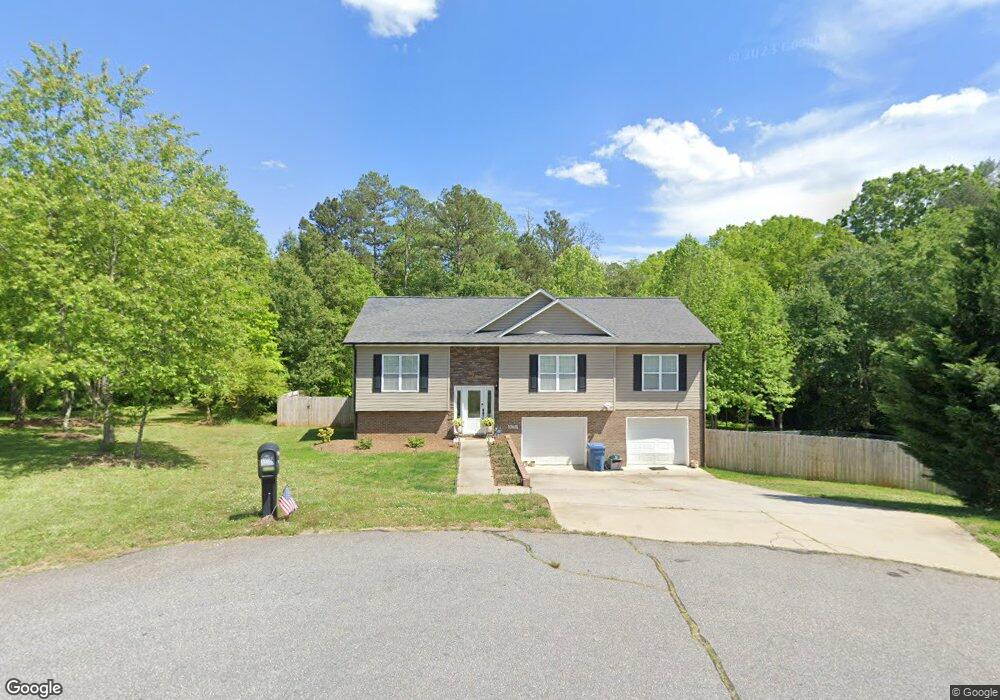
9093 McCray Farms Dr Unit 11 Hickory, NC 28601
Estimated Value: $322,000 - $334,000
3
Beds
3
Baths
1,386
Sq Ft
$237/Sq Ft
Est. Value
About This Home
This home is located at 9093 McCray Farms Dr Unit 11, Hickory, NC 28601 and is currently estimated at $327,956, approximately $236 per square foot. 9093 McCray Farms Dr Unit 11 is a home located in Burke County with nearby schools including Ray Childers Elementary School, East Burke Middle School, and East Burke High School.
Ownership History
Date
Name
Owned For
Owner Type
Purchase Details
Closed on
Jul 30, 2021
Sold by
Cornett Dana
Bought by
Tadlock Matthew Keith and Tadlock Katherine Michelle
Current Estimated Value
Home Financials for this Owner
Home Financials are based on the most recent Mortgage that was taken out on this home.
Original Mortgage
$235,653
Outstanding Balance
$214,378
Interest Rate
2.93%
Mortgage Type
FHA
Estimated Equity
$113,578
Purchase Details
Closed on
May 31, 2021
Sold by
Cornett Kevin
Bought by
Cornett Dana
Home Financials for this Owner
Home Financials are based on the most recent Mortgage that was taken out on this home.
Original Mortgage
$235,653
Outstanding Balance
$214,378
Interest Rate
2.93%
Mortgage Type
FHA
Estimated Equity
$113,578
Purchase Details
Closed on
Dec 20, 2011
Sold by
Fisher William A and Fisher Cynthia
Bought by
Cornett Dana and Cornett Kevin
Home Financials for this Owner
Home Financials are based on the most recent Mortgage that was taken out on this home.
Original Mortgage
$141,324
Interest Rate
4.06%
Mortgage Type
FHA
Create a Home Valuation Report for This Property
The Home Valuation Report is an in-depth analysis detailing your home's value as well as a comparison with similar homes in the area
Home Values in the Area
Average Home Value in this Area
Purchase History
| Date | Buyer | Sale Price | Title Company |
|---|---|---|---|
| Tadlock Matthew Keith | $241,000 | None Available | |
| Cornett Dana | -- | None Available | |
| Cornett Dana | $145,000 | None Available |
Source: Public Records
Mortgage History
| Date | Status | Borrower | Loan Amount |
|---|---|---|---|
| Open | Tadlock Matthew Keith | $235,653 | |
| Previous Owner | Cornett Dana | $141,324 |
Source: Public Records
Tax History Compared to Growth
Tax History
| Year | Tax Paid | Tax Assessment Tax Assessment Total Assessment is a certain percentage of the fair market value that is determined by local assessors to be the total taxable value of land and additions on the property. | Land | Improvement |
|---|---|---|---|---|
| 2025 | $1,933 | $272,725 | $22,166 | $250,559 |
| 2024 | $1,943 | $272,725 | $22,166 | $250,559 |
| 2023 | $1,943 | $272,725 | $22,166 | $250,559 |
| 2022 | $1,431 | $165,503 | $19,796 | $145,707 |
| 2021 | $1,365 | $162,176 | $19,796 | $142,380 |
| 2020 | $1,361 | $162,176 | $19,796 | $142,380 |
| 2019 | $1,361 | $162,176 | $19,796 | $142,380 |
| 2018 | $1,323 | $157,388 | $19,796 | $137,592 |
| 2017 | $1,321 | $157,388 | $19,796 | $137,592 |
| 2016 | $1,274 | $157,388 | $19,796 | $137,592 |
| 2015 | $1,271 | $157,388 | $19,796 | $137,592 |
| 2014 | $1,269 | $157,388 | $19,796 | $137,592 |
| 2013 | $1,269 | $157,388 | $19,796 | $137,592 |
Source: Public Records
Map
Nearby Homes
- 2478 Harvest Dr Unit 17
- 2480 Harvest Dr Unit 16
- 2484 Harvest Dr Unit 15
- 2488 Harvest Dr Unit 14 and 12
- 2764 Cliftwood Cir
- 676 Cape Hickory Rd Unit 20
- 2359 Settlemyre Lail St Unit 33
- 9165 Cherokee Dr
- 0 Liberty Church Rd
- 9459 Westridge Dr
- 2627 South Ct
- 8782 Shepherd Ct
- 3511 Warlicks Church Rd
- 8940 Wilson Rd
- 3576 Warlicks Church Rd
- 2066 Lake Acres Dr
- 0 Ridge Dr Unit CAR3835553
- 108 Dogwood Dr
- 106 Dogwood Dr
- 3154 Ridge Dr Unit 71,72,73,74
- 9093 McCray Farms Dr
- 9084 McCray Farms Dr Unit 255
- 9081 McCray Farms Dr
- 9081 McCray Farms Dr Unit 240
- 2492 Harvest Dr
- 9075 McCray Farms Dr
- 2491 Harvest Dr
- 2816 Cliftwood Cir
- 2515 Townsend Rd Unit 25
- 2825 Cliftwood Cir
- 2580 Hart Hill Rd
- V/L Hart Hill Unit 30
- 2885 Cliftwood Cir
- 2483 Harvest Dr
- 2804 Cliftwood Cir
- 2815 Cliftwood Cir
- 9054 McCray Farms Dr
- 2905 Cliftwood Cir
- 2475 Harvest Dr
- 2769 Cliftwood Cir