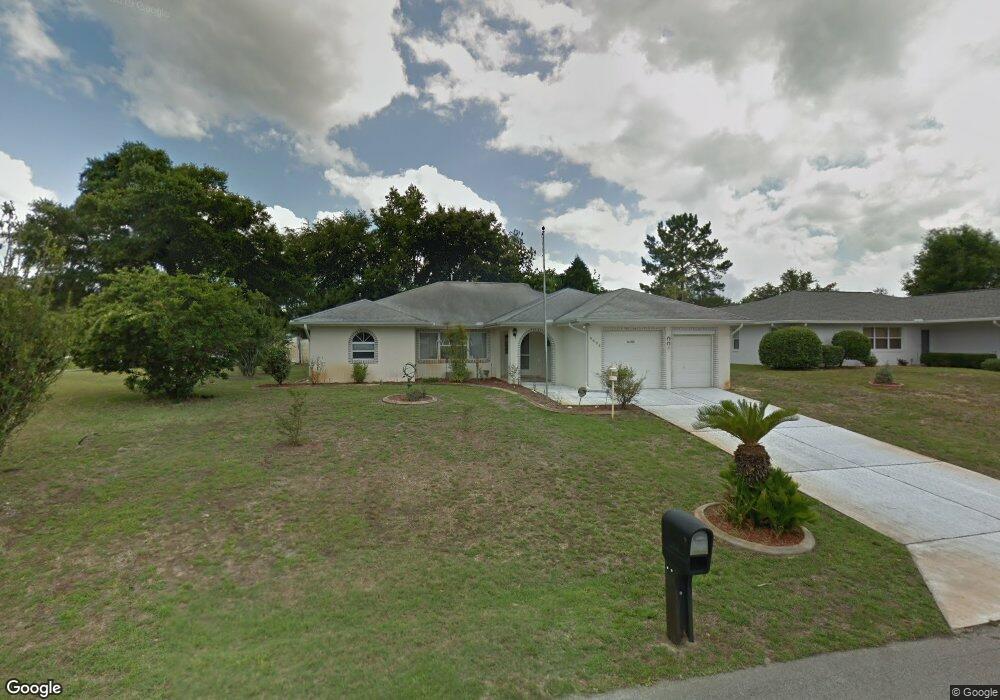
9096 E Coker Creek Ln Inverness, FL 34450
Estimated Value: $360,000 - $402,000
3
Beds
2
Baths
2,042
Sq Ft
$185/Sq Ft
Est. Value
About This Home
This home is located at 9096 E Coker Creek Ln, Inverness, FL 34450 and is currently estimated at $377,717, approximately $184 per square foot. 9096 E Coker Creek Ln is a home located in Citrus County with nearby schools including Inverness Primary School, Inverness Middle School, and Citrus High School.
Ownership History
Date
Name
Owned For
Owner Type
Purchase Details
Closed on
May 22, 2014
Sold by
Nassibian Arousiag
Bought by
Stauffer Charles W and Stauffer Jennifer L
Current Estimated Value
Home Financials for this Owner
Home Financials are based on the most recent Mortgage that was taken out on this home.
Original Mortgage
$112,365
Outstanding Balance
$85,731
Interest Rate
4.36%
Mortgage Type
VA
Estimated Equity
$291,986
Purchase Details
Closed on
Oct 4, 2012
Sold by
Nassibian Arousiag E and Nassibian Karl E
Bought by
Nassibian Arousiag
Purchase Details
Closed on
Oct 1, 2012
Bought by
Stauffer Charles W and Stauffer Jennifer L
Purchase Details
Closed on
Jul 30, 2008
Sold by
Svensson Ankine V
Bought by
Svensson Ankine V E and Svensson Karl E
Purchase Details
Closed on
Jul 1, 2008
Bought by
Stauffer Charles W and Stauffer Jennifer L
Create a Home Valuation Report for This Property
The Home Valuation Report is an in-depth analysis detailing your home's value as well as a comparison with similar homes in the area
Home Values in the Area
Average Home Value in this Area
Purchase History
| Date | Buyer | Sale Price | Title Company |
|---|---|---|---|
| Stauffer Charles W | $110,000 | A 1 Title Of The Nature Coas | |
| Nassibian Arousiag | -- | Attorney | |
| Stauffer Charles W | $100 | -- | |
| Svensson Ankine V E | -- | Attorney | |
| Stauffer Charles W | $100 | -- |
Source: Public Records
Mortgage History
| Date | Status | Borrower | Loan Amount |
|---|---|---|---|
| Open | Stauffer Charles W | $112,365 |
Source: Public Records
Tax History Compared to Growth
Tax History
| Year | Tax Paid | Tax Assessment Tax Assessment Total Assessment is a certain percentage of the fair market value that is determined by local assessors to be the total taxable value of land and additions on the property. | Land | Improvement |
|---|---|---|---|---|
| 2024 | $2,100 | $175,250 | -- | -- |
| 2023 | $2,100 | $170,146 | $0 | $0 |
| 2022 | $1,965 | $165,190 | $0 | $0 |
| 2021 | $1,885 | $160,379 | $0 | $0 |
| 2020 | $1,577 | $182,842 | $17,860 | $164,982 |
| 2019 | $1,512 | $165,435 | $17,860 | $147,575 |
| 2018 | $1,483 | $155,748 | $17,860 | $137,888 |
| 2017 | $1,475 | $129,851 | $17,860 | $111,991 |
| 2016 | $1,490 | $127,180 | $17,860 | $109,320 |
| 2015 | $2,049 | $120,078 | $17,860 | $102,218 |
| 2014 | $2,007 | $113,490 | $17,584 | $95,906 |
Source: Public Records
Map
Nearby Homes
- 9082 E Coker Creek Ln
- 3061 S Franklin Terrace
- 3111 S Blackmountain Dr
- 8711 E Cresco Ln
- 3499 S Stroud Terrace
- 8831 E Sandpiper Dr
- 3231 S Eagle Point
- 2908 S Skyline Dr
- 9293 E Windwood Loop
- 8725 E Rosemont Ct
- 2457 S Summerwood Point
- 2435 S Summerwood Point
- 9495 E Baymeadows Dr
- 9515 E Baymeadows Dr
- 2550 S Bali Point
- 9467 E Baymeadows Dr
- 9546 E Baymeadows Dr
- 8505 E Sandpiper Dr
- 9520 E Baymeadows Dr
- 3203 S Skyline Dr
- 9095 E China Grove Ln
- 9070 E Coker Creek Ln
- 9109 E China Grove Ln
- 9107 E Coker Creek Ln
- 9089 E Coker Creek Ln
- 9081 E China Grove Ln
- 9065 E China Grove Ln
- 3123 S Hiawassee Terrace
- 9054 E Coker Creek Ln
- 3141 S Hiawassee Terrace
- 3107 S Hiawassee Terrace
- 3095 S Tellico Terrace
- 9080 E China Grove Ln
- 3159 S Hiawassee Terrace
- 9094 E China Grove Ln
- 9108 E China Grove Ln
- 3091 S Hiawassee Terrace
- 3081 S Tellico Terrace
- 3175 S Hiawassee Terrace