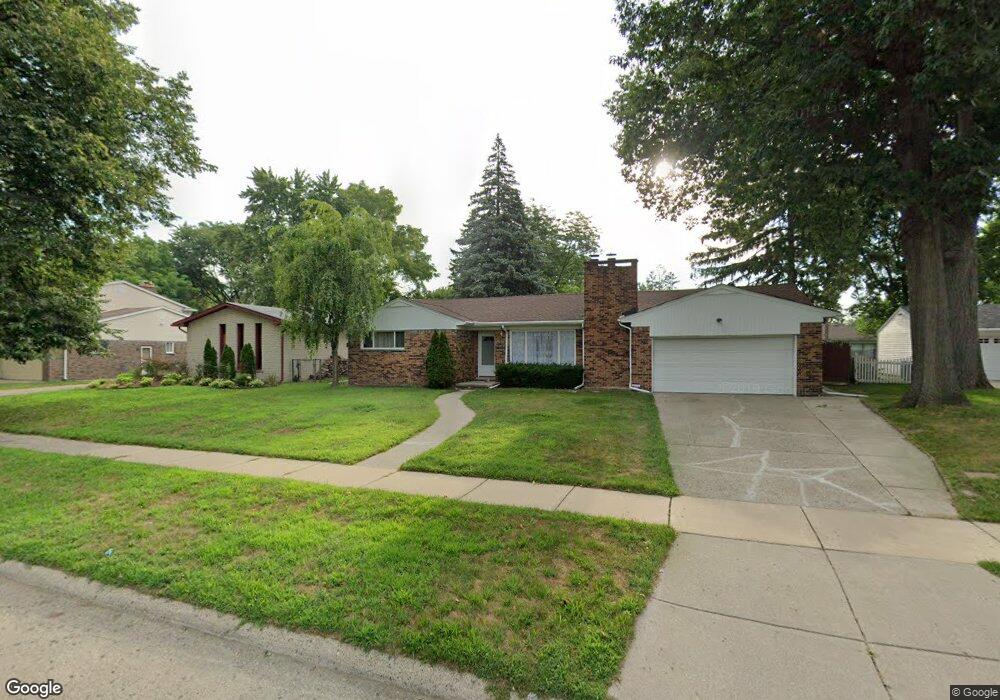
9096 Virgil Unit Bldg-Unit Redford, MI 48239
Estimated Value: $203,000 - $259,000
--
Bed
2
Baths
1,407
Sq Ft
$167/Sq Ft
Est. Value
About This Home
This home is located at 9096 Virgil Unit Bldg-Unit, Redford, MI 48239 and is currently estimated at $235,278, approximately $167 per square foot. 9096 Virgil Unit Bldg-Unit is a home located in Wayne County with nearby schools including John D. Pierce Middle School, Lee M. Thurston High School, and Global Heights Academy.
Ownership History
Date
Name
Owned For
Owner Type
Purchase Details
Closed on
Aug 15, 2018
Sold by
Cai Peter
Bought by
Terrell Yonique
Current Estimated Value
Purchase Details
Closed on
Jun 13, 2014
Sold by
Oldakowska Marianan and Oldakowski Krysztof
Bought by
Cai Peter
Purchase Details
Closed on
Jul 8, 2008
Sold by
Oldakowski Dariusz
Bought by
Oldakowska Marianna
Purchase Details
Closed on
Nov 27, 2007
Sold by
Manns Yakell
Bought by
Oldakowski Dariusz
Purchase Details
Closed on
Apr 11, 2007
Sold by
Summers Wanda
Bought by
Wells Fargo Bank Na and Abfc Asset Backed Certificates Series 20
Create a Home Valuation Report for This Property
The Home Valuation Report is an in-depth analysis detailing your home's value as well as a comparison with similar homes in the area
Home Values in the Area
Average Home Value in this Area
Purchase History
| Date | Buyer | Sale Price | Title Company |
|---|---|---|---|
| Terrell Yonique | $150,000 | Reputation First Title Agenc | |
| Cai Peter | $73,000 | Partners Title Agency Llc | |
| Oldakowska Marianna | -- | Chicago Title Insurance Co | |
| Oldakowski Dariusz | $85,001 | Bell Title Agency Farmington | |
| Wells Fargo Bank Na | $119,000 | None Available |
Source: Public Records
Tax History Compared to Growth
Tax History
| Year | Tax Paid | Tax Assessment Tax Assessment Total Assessment is a certain percentage of the fair market value that is determined by local assessors to be the total taxable value of land and additions on the property. | Land | Improvement |
|---|---|---|---|---|
| 2025 | $1,353 | $89,800 | $0 | $0 |
| 2024 | $1,353 | $87,300 | $0 | $0 |
| 2023 | $1,295 | $92,200 | $0 | $0 |
| 2022 | $3,660 | $76,600 | $0 | $0 |
| 2021 | $3,556 | $72,300 | $0 | $0 |
| 2020 | $3,506 | $62,800 | $0 | $0 |
| 2019 | $3,428 | $51,800 | $0 | $0 |
| 2018 | $1,076 | $45,600 | $0 | $0 |
| 2017 | $3,265 | $41,400 | $0 | $0 |
| 2016 | $2,866 | $36,200 | $0 | $0 |
| 2015 | $3,240 | $32,400 | $0 | $0 |
| 2013 | $3,540 | $36,100 | $0 | $0 |
| 2012 | $2,243 | $40,400 | $10,000 | $30,400 |
Source: Public Records
Map
Nearby Homes