Estimated Value: $697,000 - $764,000
3
Beds
3
Baths
3,150
Sq Ft
$232/Sq Ft
Est. Value
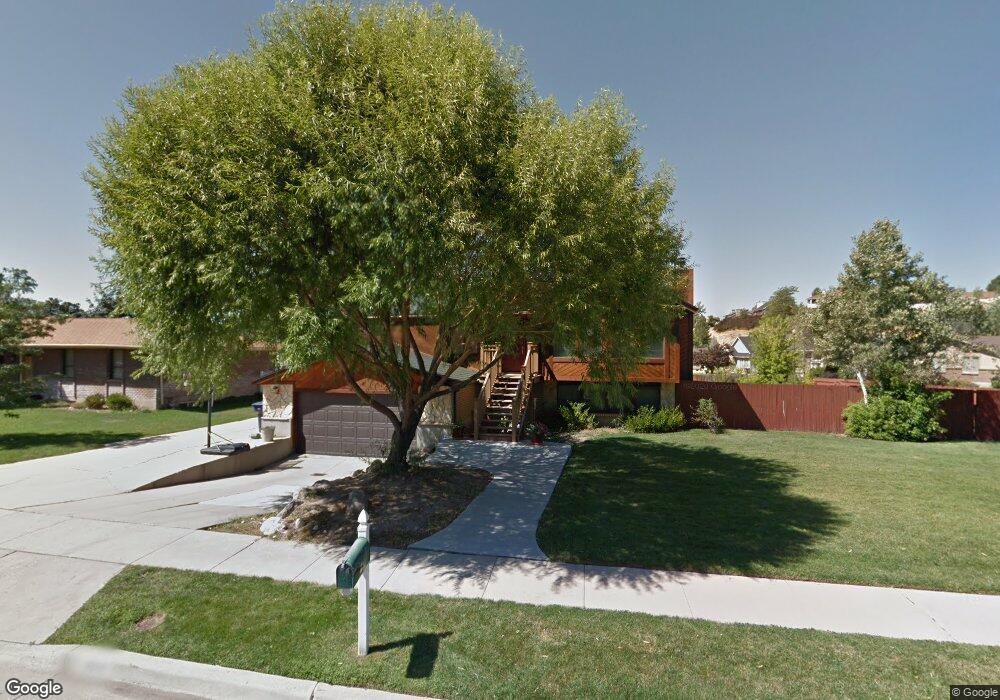
About This Home
This home is located at 9098 S La Grange Way, Sandy, UT 84093 and is currently estimated at $730,137, approximately $231 per square foot. 9098 S La Grange Way is a home located in Salt Lake County with nearby schools including Silver Mesa Elementary School, Albion Middle School, and Brighton High School.
Ownership History
Date
Name
Owned For
Owner Type
Purchase Details
Closed on
Mar 30, 2007
Sold by
Nalder Todd R and Nalder Deborah D
Bought by
Graybill Orin M and Graybill Meagan N
Current Estimated Value
Purchase Details
Closed on
Dec 8, 1993
Sold by
Zitting Robert C and Zitting Melanie L
Bought by
Nalder Todd R and Nalder Deborah D
Home Financials for this Owner
Home Financials are based on the most recent Mortgage that was taken out on this home.
Original Mortgage
$132,033
Interest Rate
5.5%
Mortgage Type
VA
Create a Home Valuation Report for This Property
The Home Valuation Report is an in-depth analysis detailing your home's value as well as a comparison with similar homes in the area
Home Values in the Area
Average Home Value in this Area
Purchase History
| Date | Buyer | Sale Price | Title Company |
|---|---|---|---|
| Graybill Orin M | -- | None Available | |
| Nalder Todd R | -- | -- |
Source: Public Records
Mortgage History
| Date | Status | Borrower | Loan Amount |
|---|---|---|---|
| Previous Owner | Nalder Todd R | $132,033 |
Source: Public Records
Tax History Compared to Growth
Tax History
| Year | Tax Paid | Tax Assessment Tax Assessment Total Assessment is a certain percentage of the fair market value that is determined by local assessors to be the total taxable value of land and additions on the property. | Land | Improvement |
|---|---|---|---|---|
| 2025 | $3,568 | $681,300 | $236,800 | $444,500 |
| 2024 | $3,568 | $668,800 | $225,500 | $443,300 |
| 2023 | $3,467 | $633,800 | $214,300 | $419,500 |
| 2022 | $3,196 | $588,300 | $210,100 | $378,200 |
| 2021 | $2,936 | $447,600 | $168,100 | $279,500 |
| 2020 | $2,717 | $401,800 | $168,100 | $233,700 |
| 2019 | $2,573 | $371,200 | $159,600 | $211,600 |
| 2018 | $2,432 | $367,000 | $159,600 | $207,400 |
| 2017 | $2,270 | $327,700 | $159,600 | $168,100 |
| 2016 | $2,331 | $325,200 | $159,600 | $165,600 |
| 2015 | $2,202 | $284,800 | $154,800 | $130,000 |
| 2014 | $2,145 | $272,500 | $150,000 | $122,500 |
Source: Public Records
Map
Nearby Homes
- 9130 Maison Dr
- 9171 Strasbourg Cir
- 9123 Meadow Ct
- 8888 S Renegade Rd
- 1924 E Viscounti Cove
- 9460 S Tramway Dr
- 8638 Piper Ln
- 1616 Waters Ln
- 8571 Monitor Dr
- 1990 E Terra Vista Way
- 8965 Quail Run Dr
- 2311 Snow Mountain Dr
- 8483 S Terrace Dr
- 1482 Waters Ln
- 2131 Gad Way
- 9277 S 1520 E
- 2509 E Cobblestone Way
- 1492 E Sandy Hills Dr
- 1393 E Galaxie Dr
- 1430 E 8685 S
- 9098 La Grange Way
- 9108 S La Grange Way
- 9108 La Grange Way
- 1956 Somerville Dr
- 9099 La Grange Way
- 9113 Tortellini Dr
- 1967 Somerville Dr
- 1961 Somerville Dr
- 9091 S La Grange Way
- 9091 La Grange Way
- 9107 La Grange Way
- 9118 S La Grange Way
- 9118 La Grange Way
- 1953 Somerville Dr
- 1953 E Somerville Dr
- 9121 Tortellini Dr
- 9121 S Tortellini Dr
- 9117 La Grange Way
- 1975 Somerville Dr
- 1943 Somerville Dr