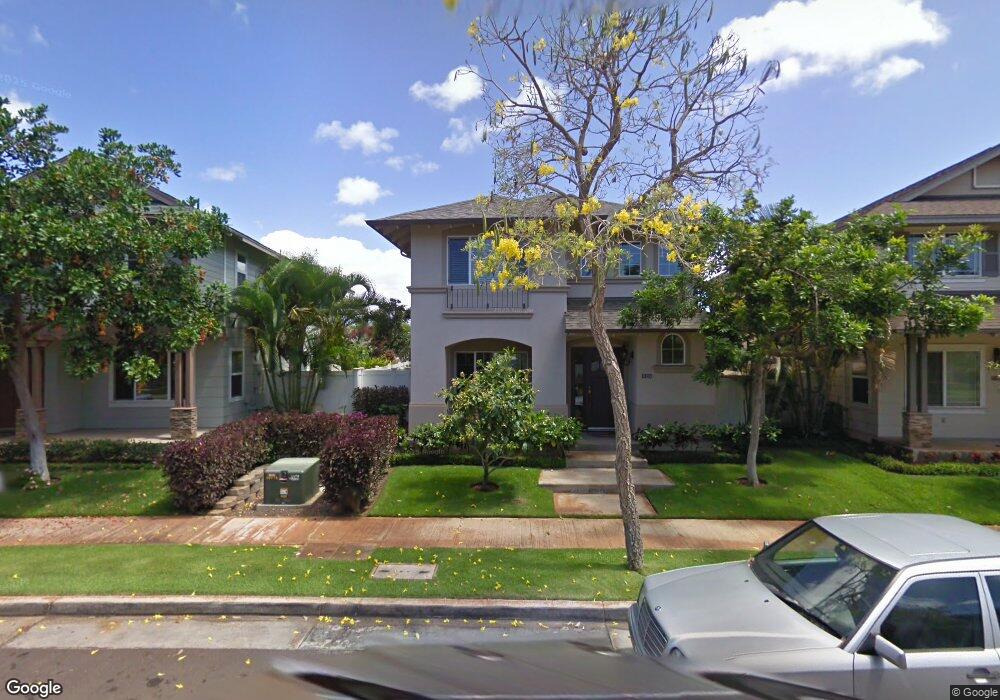
91-1024 Kaikane St Ewa Beach, HI 96706
Estimated Value: $1,029,000 - $1,119,000
4
Beds
3
Baths
1,803
Sq Ft
$597/Sq Ft
Est. Value
About This Home
This home is located at 91-1024 Kaikane St, Ewa Beach, HI 96706 and is currently estimated at $1,075,534, approximately $596 per square foot. 91-1024 Kaikane St is a home located in Honolulu County with nearby schools including Keoneula Elementary School, Ewa Makai Middle School, and James Campbell High School.
Ownership History
Date
Name
Owned For
Owner Type
Purchase Details
Closed on
May 30, 2019
Sold by
Abukoff Scott Martin
Bought by
Abukoff Scott Martin and Abukoff Victoria Jeanne
Current Estimated Value
Purchase Details
Closed on
Mar 14, 2011
Sold by
Mckenna Jon Andrew and Mckenna Roswitha Wagner
Bought by
Abukoff Scott Martin
Home Financials for this Owner
Home Financials are based on the most recent Mortgage that was taken out on this home.
Original Mortgage
$565,051
Interest Rate
4.77%
Mortgage Type
VA
Purchase Details
Closed on
May 3, 2003
Sold by
Ke Noho Kai Development Llc
Bought by
Mckenna Jon Andrew and Mckenna Roswitha Wagner
Home Financials for this Owner
Home Financials are based on the most recent Mortgage that was taken out on this home.
Original Mortgage
$295,850
Interest Rate
5.71%
Mortgage Type
Unknown
Create a Home Valuation Report for This Property
The Home Valuation Report is an in-depth analysis detailing your home's value as well as a comparison with similar homes in the area
Home Values in the Area
Average Home Value in this Area
Purchase History
| Date | Buyer | Sale Price | Title Company |
|---|---|---|---|
| Abukoff Scott Martin | -- | None Available | |
| Abukoff Scott Martin | -- | None Available | |
| Abukoff Scott Martin | -- | None Available | |
| Abukoff Scott Martin | $547,000 | Fam | |
| Mckenna Jon Andrew | $369,800 | -- |
Source: Public Records
Mortgage History
| Date | Status | Borrower | Loan Amount |
|---|---|---|---|
| Previous Owner | Abukoff Scott Martin | $565,051 | |
| Previous Owner | Mckenna Jon Andrew | $295,850 | |
| Closed | Mckenna Jon Andrew | $55,450 |
Source: Public Records
Tax History Compared to Growth
Tax History
| Year | Tax Paid | Tax Assessment Tax Assessment Total Assessment is a certain percentage of the fair market value that is determined by local assessors to be the total taxable value of land and additions on the property. | Land | Improvement |
|---|---|---|---|---|
| 2025 | $3,113 | $973,700 | $629,800 | $343,900 |
| 2024 | $3,113 | $1,049,300 | $647,800 | $401,500 |
| 2023 | $2,804 | $1,041,200 | $694,600 | $346,600 |
| 2022 | $2,800 | $899,900 | $583,000 | $316,900 |
| 2021 | $2,233 | $738,000 | $406,700 | $331,300 |
| 2020 | $2,240 | $740,100 | $397,700 | $342,400 |
| 2019 | $2,370 | $757,100 | $413,900 | $343,200 |
| 2018 | $2,225 | $715,600 | $367,100 | $348,500 |
| 2017 | $2,349 | $671,000 | $287,900 | $383,100 |
| 2016 | $2,274 | $649,700 | $282,100 | $367,600 |
| 2015 | $2,190 | $625,700 | $282,100 | $343,600 |
| 2014 | -- | $597,500 | $238,700 | $358,800 |
Source: Public Records
Map
Nearby Homes
- 91-1153 Kaileonui St
- 91-1035 Kaiko St
- 91-1121 Keoneula Blvd Unit L5
- 91-6417 Kapolei Pkwy
- 91-1061 Kaileolea Dr Unit 2C1
- 91-1033 Kaipalaoa St Unit 1402
- 91-1027 Kaipalaoa St Unit 1103
- 91-1050 Kaikauhaa St
- 91-2032 Kaioli St Unit 6006
- 91-1105 Kaiko St
- 91-1211 Keoneula Blvd Unit 2D5
- 91-2070 Kaioli St Unit 4403
- 91-1059 Keoneula Blvd Unit F4
- 91-1002 Kaiapele St
- 91-2123 Kaioli St Unit 3001
- 91-1054 Kaiheenalu St
- 91-2017 Kaioli St Unit 4102
- 91-2091 Kaioli St Unit 1602
- 91-2083 Kaioli St Unit 1303
- 91-2071 Kaioli St Unit 701
- 91-1028 Kaikane St
- 91-1020 Kaikane St
- 91-1016 Kaikane St
- 91-1135 Kaipu St
- 91-1133 Kaipu St
- 91-1036 Kaikane St
- 91-1137 Kaipu St
- 91-1012 Kaikane St
- 91-1129 Kaipu St
- 91-1141 Kaipu St
- 91-1127 Kaipu St
- 91-1029 Kaikane St
- 91-1023 Kaikane St
- 91-1040 Kaikane St
- 91-1123 Kaipu St
- 91-1143 Kaipu St
- 91-1033 Kaikane St
- 91-1008 Kaikane St
- 91-1017 Kaikane St
- 91-1121 Kaipu St