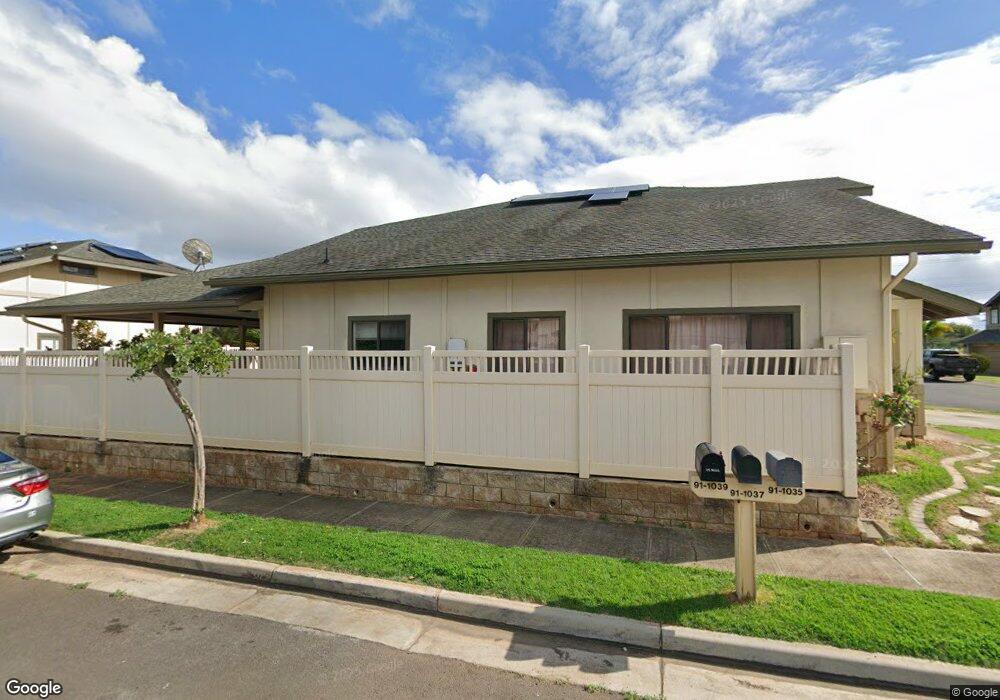
91-1039 Papaa St Kapolei, HI 96707
Estimated Value: $847,000 - $1,103,000
4
Beds
3
Baths
1,787
Sq Ft
$551/Sq Ft
Est. Value
About This Home
This home is located at 91-1039 Papaa St, Kapolei, HI 96707 and is currently estimated at $984,579, approximately $550 per square foot. 91-1039 Papaa St is a home located in Honolulu County with nearby schools including Hookele El, Kapolei Middle School, and Kapolei High School.
Ownership History
Date
Name
Owned For
Owner Type
Purchase Details
Closed on
Sep 29, 2007
Sold by
Udani Roland Udani and Udani Geocelyn Manuel
Bought by
Udani Roland U and Udani Geocelyn M
Current Estimated Value
Purchase Details
Closed on
Jul 25, 2003
Sold by
Makai Village Partnership
Bought by
Udani Roland Udani and Udani Geocelyn Manuel
Home Financials for this Owner
Home Financials are based on the most recent Mortgage that was taken out on this home.
Original Mortgage
$273,537
Outstanding Balance
$115,155
Interest Rate
5.13%
Mortgage Type
Unknown
Estimated Equity
$869,424
Purchase Details
Closed on
Jul 13, 2003
Sold by
Housing & Cmnty Development Corp Of Hi
Bought by
Makai Village Partnership
Home Financials for this Owner
Home Financials are based on the most recent Mortgage that was taken out on this home.
Original Mortgage
$273,537
Outstanding Balance
$115,155
Interest Rate
5.13%
Mortgage Type
Unknown
Estimated Equity
$869,424
Create a Home Valuation Report for This Property
The Home Valuation Report is an in-depth analysis detailing your home's value as well as a comparison with similar homes in the area
Home Values in the Area
Average Home Value in this Area
Purchase History
| Date | Buyer | Sale Price | Title Company |
|---|---|---|---|
| Udani Roland U | -- | None Available | |
| Udani Roland Udani | $332,100 | -- | |
| Makai Village Partnership | $12,600 | -- |
Source: Public Records
Mortgage History
| Date | Status | Borrower | Loan Amount |
|---|---|---|---|
| Open | Udani Roland Udani | $273,537 | |
| Closed | Udani Roland Udani | $40,000 |
Source: Public Records
Tax History Compared to Growth
Tax History
| Year | Tax Paid | Tax Assessment Tax Assessment Total Assessment is a certain percentage of the fair market value that is determined by local assessors to be the total taxable value of land and additions on the property. | Land | Improvement |
|---|---|---|---|---|
| 2025 | $3,073 | $1,004,700 | $570,400 | $434,300 |
| 2024 | $3,073 | $998,100 | $607,200 | $390,900 |
| 2023 | $2,889 | $1,025,500 | $625,600 | $399,900 |
| 2022 | $2,692 | $869,100 | $570,400 | $298,700 |
| 2021 | $2,377 | $779,200 | $449,000 | $330,200 |
| 2020 | $2,329 | $765,400 | $439,400 | $326,000 |
| 2019 | $2,370 | $757,000 | $421,500 | $335,500 |
| 2018 | $2,237 | $719,000 | $385,800 | $333,200 |
| 2017 | $2,037 | $662,000 | $296,500 | $365,500 |
| 2016 | $1,943 | $635,100 | $278,600 | $356,500 |
| 2015 | $1,897 | $622,100 | $278,600 | $343,500 |
| 2014 | -- | $566,800 | $214,300 | $352,500 |
Source: Public Records
Map
Nearby Homes
- 91-1093 Kaupea St
- 91-1083 Kaupea St
- 91-1191 Kaiau Ave Unit 1607
- 91-1191 Kaiau Ave Unit 1602
- 91-1075 Lanakoi St
- 91-1171 Kaiau Ave Unit 205
- 91-1175 Kaiau Ave Unit 903
- 91-1058J Kekuilani Loop Unit 907
- 91-1058 Kekuilani Loop Unit 502
- 91-1058 Kekuilani Loop Unit 1701
- 91-1058 Kekuilani Loop Unit 1804
- 91-1147 Kamaaha Loop Unit 6F
- 91-1165 Kamaaha Loop Unit 14H
- 91-1167 Kamaaha Loop Unit 19F
- 91-1163 Kamaaha Loop Unit 13C
- 91-1143 Kamaaha Loop Unit 17B
- 91-1259 Kamaaha Ave Unit 101
- 91-211 Kakuhihewa Place Unit F
- 91-1033 Keokolo St Unit B
- 91-1227 Kamaaha Ave Unit 302
- 91-1037 Papaa St
- 91-1041 Papaa St
- 91-1043 Papaa St
- 91-1035 Papaa St
- 91-1036 Papaa St
- 91-1029 Papaa St
- 91-1040 Papaa St
- 91-1031 Papaa St
- 91-1032 Papaa St
- 91-1042 Papaa St
- 91-1045 Papaa St
- 91-1033 Papaa St
- 91-1030 Papaa St
- 91-1046 Papaa St
- 91-1015 Pakaweli St
- 91-1019 Pakaweli St
- 91-1013 Pakaweli St
- 91-1025 Papaa St
- 91-1026 Papaa St
- 91-1023 Pakaweli St