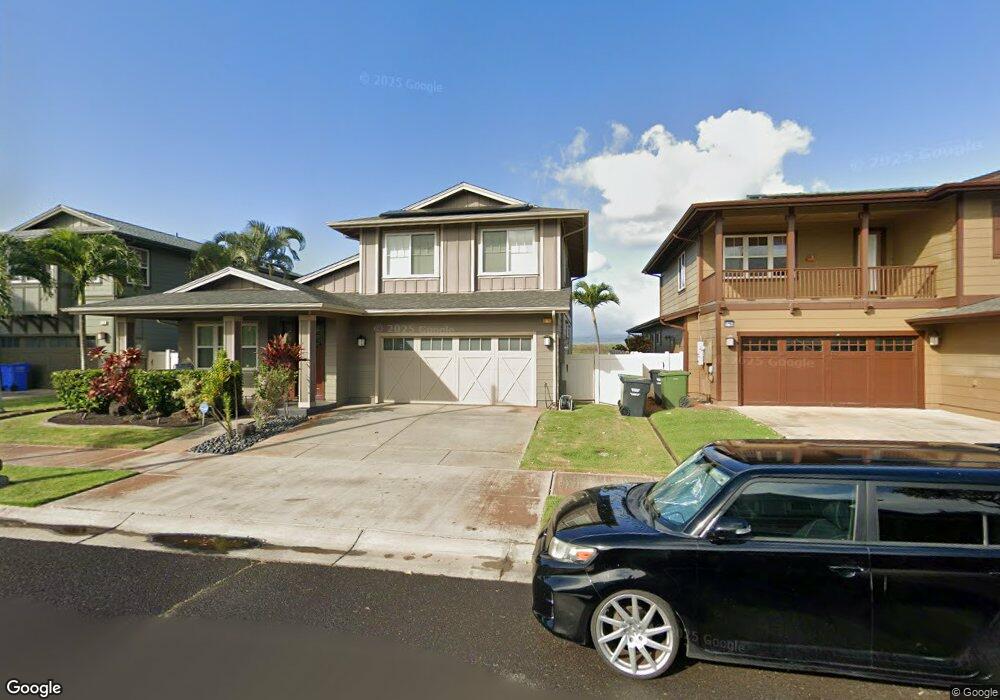
91-1164 Hoomahana St Ewa Beach, HI 96706
Estimated Value: $1,160,000 - $1,403,000
4
Beds
3
Baths
2,103
Sq Ft
$610/Sq Ft
Est. Value
About This Home
This home is located at 91-1164 Hoomahana St, Ewa Beach, HI 96706 and is currently estimated at $1,282,493, approximately $609 per square foot. 91-1164 Hoomahana St is a home located in Honolulu County with nearby schools including Pohakea Elementary School, Ilima Intermediate School, and James Campbell High School.
Ownership History
Date
Name
Owned For
Owner Type
Purchase Details
Closed on
Mar 16, 2016
Sold by
Thomas Annie Kaleiwahea
Bought by
Ikegami Sheen Shikaru and Ikegami Leilehua Kamalii
Current Estimated Value
Home Financials for this Owner
Home Financials are based on the most recent Mortgage that was taken out on this home.
Original Mortgage
$24,000
Outstanding Balance
$18,996
Interest Rate
3.65%
Mortgage Type
Credit Line Revolving
Estimated Equity
$1,263,497
Purchase Details
Closed on
Aug 14, 2006
Sold by
Gentry Homes Ltd
Bought by
Thomas Charles Henry and Thomas Annie Kaleiwahea
Home Financials for this Owner
Home Financials are based on the most recent Mortgage that was taken out on this home.
Original Mortgage
$536,900
Interest Rate
6.76%
Mortgage Type
Unknown
Create a Home Valuation Report for This Property
The Home Valuation Report is an in-depth analysis detailing your home's value as well as a comparison with similar homes in the area
Home Values in the Area
Average Home Value in this Area
Purchase History
| Date | Buyer | Sale Price | Title Company |
|---|---|---|---|
| Ikegami Sheen Shikaru | -- | Fidelity Natl Title & Escrow | |
| Ikegami Sheen Shikaru | -- | Fidelity Natl Title & Escrow | |
| Thomas Charles Henry | $671,150 | None Available |
Source: Public Records
Mortgage History
| Date | Status | Borrower | Loan Amount |
|---|---|---|---|
| Open | Ikegami Sheen Shikaru | $24,000 | |
| Closed | Ikegami Sheen Shikaru | $24,000 | |
| Open | Ikegami Sheen Shikaru | $622,950 | |
| Closed | Ikegami Sheen Shikaru | $622,950 | |
| Previous Owner | Thomas Charles Henry | $536,900 |
Source: Public Records
Tax History Compared to Growth
Tax History
| Year | Tax Paid | Tax Assessment Tax Assessment Total Assessment is a certain percentage of the fair market value that is determined by local assessors to be the total taxable value of land and additions on the property. | Land | Improvement |
|---|---|---|---|---|
| 2025 | $4,030 | $1,345,700 | $850,700 | $495,000 |
| 2024 | $4,030 | $1,271,300 | $880,700 | $390,600 |
| 2023 | $3,894 | $1,312,700 | $940,800 | $371,900 |
| 2022 | $3,340 | $1,054,300 | $646,300 | $408,000 |
| 2021 | $2,550 | $828,500 | $411,800 | $416,700 |
| 2020 | $2,472 | $806,400 | $425,900 | $380,500 |
| 2019 | $2,609 | $825,500 | $400,800 | $424,700 |
| 2018 | $2,523 | $800,800 | $370,700 | $430,100 |
| 2017 | $2,380 | $759,900 | $272,000 | $487,900 |
| 2016 | $2,399 | $685,500 | $256,400 | $429,100 |
| 2015 | -- | $670,700 | $248,600 | $422,100 |
| 2014 | -- | $652,100 | $256,400 | $395,700 |
Source: Public Records
Map
Nearby Homes
- 91-1227 Kuanoo St
- 91-1219 Kuanoo St
- 91-1298 Kuanoo St
- 91-1151 Kanela St Unit M3
- 91-1067 Hoomahana St
- 91-1205 Kanela St Unit M36
- 91-1197 Kanela St Unit M40
- 91-919 Hoomohalu Place
- 91-632 Makalea St Unit 76
- 91-215 Kuanoo Place
- 91-466 Makalea St Unit 112
- 91-1857 Luahoana St Unit 126
- 91-3066 Makalea Loop Unit 53
- 91-1860 Luahoana St Unit 114
- 91-422 Makalea St Unit 94
- 91-939 Hanakahi St
- 91-698 Makalea St Unit 118
- 91-1200 Keaunui Dr Unit 208
- 91-1200 Keaunui Dr Unit 110
- 91-1200 Keaunui Dr Unit 309
- 91-1164 Ho'Omahana St
- 91-1168 Ho'Omahana St
- 91-1168 Hoomahana St
- 91-1160 Hoomahana St
- 91-1160 Ho'Omahana St
- 91-1170 Hoomahana St
- 91-1156 Hoomahana St
- 91-1161 Hoomahana St
- 91-1165 Hoomahana St
- 91-1174 Ho'Omahana St
- 91-1174 Hoomahana St
- 91-1169 Hoomahana St
- 91-1152 Hoomahana St
- 91-1173 Hoomahana St
- 91-1250 Kuano'O St
- 91-1178 Hoomahana St
- 91-1254 Kuano'O St
- 91-1246 Kuanoo St
- 91-1148 Hoomahana St
- 91-1250 Kuanoo St