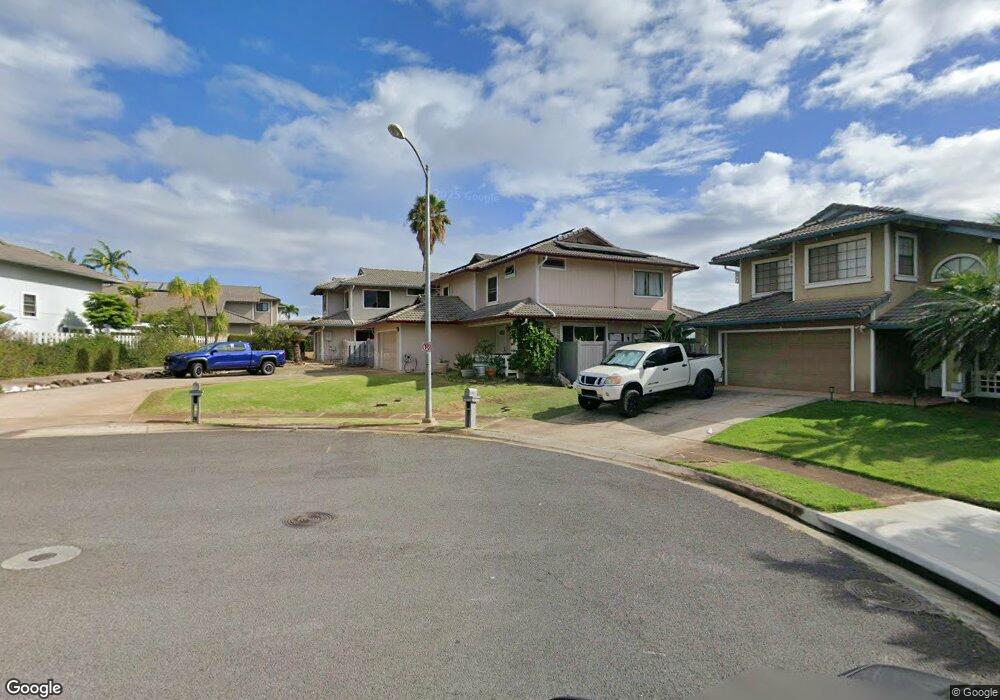
91-205 Oaniani Place Kapolei, HI 96707
Estimated Value: $1,110,000 - $1,376,000
3
Beds
3
Baths
1,754
Sq Ft
$682/Sq Ft
Est. Value
About This Home
This home is located at 91-205 Oaniani Place, Kapolei, HI 96707 and is currently estimated at $1,196,732, approximately $682 per square foot. 91-205 Oaniani Place is a home located in Honolulu County with nearby schools including Hookele El, Kapolei Middle School, and Kapolei High School.
Ownership History
Date
Name
Owned For
Owner Type
Purchase Details
Closed on
Feb 16, 2010
Sold by
Taramasco Eric James and Taramasco Wendy Leilani
Bought by
Taramasco Wendy Leilani and Wendy Leilani Taramasco Revocable Living
Current Estimated Value
Purchase Details
Closed on
Jun 23, 2005
Sold by
Kwan Kevin Wai Tong and Kwan Raymond Hung Fong
Bought by
Taramasco Eric James and Taramasco Wendy Leilani
Home Financials for this Owner
Home Financials are based on the most recent Mortgage that was taken out on this home.
Original Mortgage
$575,200
Outstanding Balance
$303,953
Interest Rate
5.95%
Mortgage Type
Fannie Mae Freddie Mac
Estimated Equity
$892,779
Purchase Details
Closed on
Mar 2, 1994
Sold by
Watt Hawaii Inc
Bought by
Kwan Kevin Wai Tong and Kwan Raymond Hung Fong
Home Financials for this Owner
Home Financials are based on the most recent Mortgage that was taken out on this home.
Original Mortgage
$300,000
Interest Rate
7%
Create a Home Valuation Report for This Property
The Home Valuation Report is an in-depth analysis detailing your home's value as well as a comparison with similar homes in the area
Home Values in the Area
Average Home Value in this Area
Purchase History
| Date | Buyer | Sale Price | Title Company |
|---|---|---|---|
| Taramasco Wendy Leilani | -- | None Available | |
| Taramasco Eric James | $719,000 | Fhtc | |
| Kwan Kevin Wai Tong | $430,300 | -- |
Source: Public Records
Mortgage History
| Date | Status | Borrower | Loan Amount |
|---|---|---|---|
| Open | Taramasco Eric James | $575,200 | |
| Previous Owner | Kwan Kevin Wai Tong | $300,000 | |
| Closed | Taramasco Eric James | $143,800 |
Source: Public Records
Tax History Compared to Growth
Tax History
| Year | Tax Paid | Tax Assessment Tax Assessment Total Assessment is a certain percentage of the fair market value that is determined by local assessors to be the total taxable value of land and additions on the property. | Land | Improvement |
|---|---|---|---|---|
| 2025 | $3,793 | $1,191,700 | $821,000 | $370,700 |
| 2024 | $3,793 | $1,203,800 | $796,100 | $407,700 |
| 2023 | $3,487 | $1,196,400 | $746,300 | $450,100 |
| 2022 | $3,317 | $1,047,600 | $686,600 | $361,000 |
| 2021 | $2,775 | $892,900 | $532,400 | $360,500 |
| 2020 | $2,588 | $839,400 | $521,700 | $317,700 |
| 2019 | $2,592 | $820,600 | $469,100 | $351,500 |
| 2018 | $2,396 | $764,500 | $442,800 | $321,700 |
| 2017 | $2,238 | $719,300 | $337,600 | $381,700 |
| 2016 | $2,069 | $671,200 | $312,600 | $358,600 |
| 2015 | $2,015 | $655,800 | $303,800 | $352,000 |
| 2014 | -- | $617,900 | $281,800 | $336,100 |
Source: Public Records
Map
Nearby Homes
- 91-209 Oaniani Place
- 91-1067 Oaniani St Unit 5
- 91-1040 Kanihaalilo St
- 91-1088 Paaoloulu Way
- 91-1058-L Kekuilani Loop Unit 1103
- 91-1002 Hokuwekiu St
- 91-1186 Namahoe St
- 91-1097 Namahoe St Unit 4D
- 91-1101 Namahoe St Unit 3H
- 91-1109 Namahoe St Unit 1L
- 91-1009 Lipo St
- 91-1022 Keokolo St Unit A
- 91-1075 Namahoe St Unit 9D
- 91-1463 Halahinano St
- 91-1033 Keokolo St Unit B
- 91-211 Kakuhihewa Place Unit F
- 91-1350 Kinoiki St
- 91-1413 Halahua St
- 91-5408 Kapolei Pkwy Unit 49
- 91-5408 Kapolei Pkwy Unit 37
- 91-201 Oaniani Place
- 91-211 Oaniani Place
- 91-983 Oaniani St
- 91-202 Oaniani Place
- 91-206 Oaniani Place
- 91-212 Oaniani Place
- 91-987 Oaniani St
- 91-210 Oaniani Place
- 91-976 Oaniani St
- 91-965 Oaniani St
- 91-991 Oaniani St
- 91-980 Oaniani St
- 91-972 Oaniani St
- 91-984 Oaniani St
- 91-968 Oaniani St
- 91-961 Oaniani St
- 91-990 Oaniani St
- 91-964 Oaniani St
- 91-957 Oaniani St
- 91-960 Oaniani St