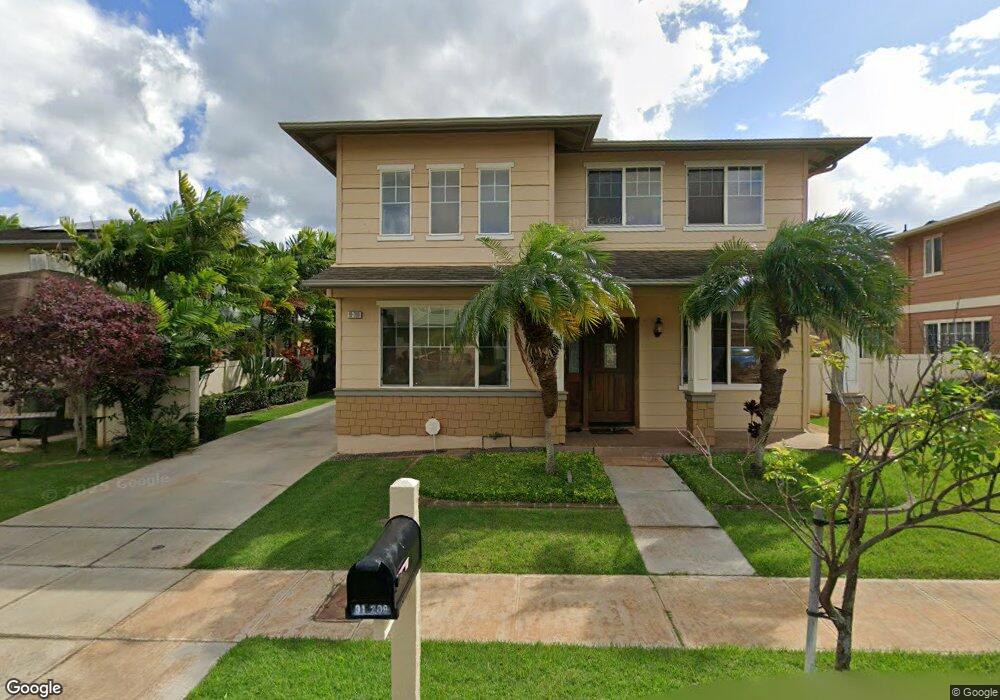
91-209 Pihapono Place Ewa Beach, HI 96706
Estimated Value: $1,320,949 - $1,371,000
3
Beds
3
Baths
2,703
Sq Ft
$497/Sq Ft
Est. Value
About This Home
This home is located at 91-209 Pihapono Place, Ewa Beach, HI 96706 and is currently estimated at $1,344,737, approximately $497 per square foot. 91-209 Pihapono Place is a home located in Honolulu County with nearby schools including Holomua Elementary School, Ilima Intermediate School, and James Campbell High School.
Ownership History
Date
Name
Owned For
Owner Type
Purchase Details
Closed on
Apr 23, 2008
Sold by
Miller Alexander William and Miller Denise Marie
Bought by
Rilveria William Mones and Rilveria Baby Ann Adoc
Current Estimated Value
Home Financials for this Owner
Home Financials are based on the most recent Mortgage that was taken out on this home.
Original Mortgage
$616,500
Outstanding Balance
$393,370
Interest Rate
6.11%
Mortgage Type
Unknown
Estimated Equity
$951,367
Purchase Details
Closed on
Jan 4, 2004
Sold by
Gentry Homes Ltd
Bought by
Miller Alexander William and Miller Denise Marie
Home Financials for this Owner
Home Financials are based on the most recent Mortgage that was taken out on this home.
Original Mortgage
$391,992
Interest Rate
5.88%
Mortgage Type
Unknown
Create a Home Valuation Report for This Property
The Home Valuation Report is an in-depth analysis detailing your home's value as well as a comparison with similar homes in the area
Home Values in the Area
Average Home Value in this Area
Purchase History
| Date | Buyer | Sale Price | Title Company |
|---|---|---|---|
| Rilveria William Mones | $685,000 | Tg | |
| Miller Alexander William | $490,000 | -- |
Source: Public Records
Mortgage History
| Date | Status | Borrower | Loan Amount |
|---|---|---|---|
| Open | Rilveria William Mones | $616,500 | |
| Previous Owner | Miller Alexander William | $391,992 | |
| Closed | Miller Alexander William | $97,998 |
Source: Public Records
Tax History Compared to Growth
Tax History
| Year | Tax Paid | Tax Assessment Tax Assessment Total Assessment is a certain percentage of the fair market value that is determined by local assessors to be the total taxable value of land and additions on the property. | Land | Improvement |
|---|---|---|---|---|
| 2025 | $3,903 | $1,272,600 | $777,400 | $495,200 |
| 2024 | $3,903 | $1,235,100 | $742,300 | $492,800 |
| 2023 | $3,724 | $1,264,100 | $742,300 | $521,800 |
| 2022 | $3,007 | $959,000 | $575,200 | $383,800 |
| 2021 | $2,738 | $882,400 | $461,700 | $420,700 |
| 2020 | $2,673 | $863,600 | $391,300 | $472,300 |
| 2019 | $2,706 | $853,000 | $391,300 | $461,700 |
| 2018 | $2,546 | $807,500 | $367,800 | $439,700 |
| 2017 | $2,392 | $763,500 | $313,000 | $450,500 |
| 2016 | $2,453 | $780,800 | $313,000 | $467,800 |
| 2015 | $2,316 | $741,700 | $266,100 | $475,600 |
| 2014 | -- | $699,400 | $242,600 | $456,800 |
Source: Public Records
Map
Nearby Homes
- 91-202 Makaina Place
- 91-1879 Olali St
- 91-1841 Keaunui Dr Unit 537
- 91-1209 Puamaeole St Unit 27S
- 91-1169 Puamaeole St Unit 23
- 91-1362 Renton Rd
- 91-1170 Puamaeole St Unit 9R
- 91-1032 Mikiala St Unit 182
- 91-1089 Puamaeole St Unit 15A
- 91-1180 Puamaeole St Unit 10
- 91-1025-B Hoomaka St Unit 76
- 91-1029 Puamaeole St Unit 2
- 91-1019 Puamaeole St Unit 1
- 91-207 Niukahiki Place Unit 64
- 91-988 Laaulu St Unit 34B
- 91-996 Laaulu St Unit 32
- 91-957 Laaulu St Unit 40
- 91-950 Laaulu St Unit 42
- 91-1021 Kuina St Unit 119
- 91-941 Laaulu St Unit 43
- 91-213 Pihapono Place
- 91-205 Pihapono Place
- 91-210 Makaike Place
- 91-206 Makaike Place
- 91-214 Makaike Place
- 91-217 Pihapono Place
- 91-201 Pihapono Place
- 91-210 Pihapono Place
- 91-214 Pihapono Place
- 91218 Makaike Place
- 91-218 Makaike Place
- 91-206 Pihapono Place
- 91-202 Makaike Place
- 91-202 Pihapono Place
- 91-218 Pihapono Place
- 91 Makahehi Loop
- 91-211 Makaike Place
- 91-207 Makaike Place
- 91-215 Makaike Place
- 91-1073 Makaike St