91-2103 Kaioli St Unit 222202 Ewa Beach, HI 96706
Estimated Value: $701,000 - $710,000
3
Beds
3
Baths
1,196
Sq Ft
$592/Sq Ft
Est. Value
About This Home
This home is located at 91-2103 Kaioli St Unit 222202, Ewa Beach, HI 96706 and is currently estimated at $707,488, approximately $591 per square foot. 91-2103 Kaioli St Unit 222202 is a home located in Honolulu County with nearby schools including Keoneula Elementary School, Ewa Makai Middle School, and James Campbell High School.
Ownership History
Date
Name
Owned For
Owner Type
Purchase Details
Closed on
Nov 4, 2025
Sold by
Hale Kevin Demingo and Pearl Brown
Bought by
Fayloga Wall Belma and Sabado Bacarro Jose
Current Estimated Value
Home Financials for this Owner
Home Financials are based on the most recent Mortgage that was taken out on this home.
Original Mortgage
$510,000
Outstanding Balance
$510,000
Interest Rate
6.3%
Mortgage Type
VA
Estimated Equity
$197,488
Purchase Details
Closed on
Apr 16, 2007
Sold by
Fairways Edge Development Llc
Bought by
Hale Kevin Demingo and Hale Pearl Brown
Home Financials for this Owner
Home Financials are based on the most recent Mortgage that was taken out on this home.
Original Mortgage
$364,520
Interest Rate
6.1%
Mortgage Type
New Conventional
Create a Home Valuation Report for This Property
The Home Valuation Report is an in-depth analysis detailing your home's value as well as a comparison with similar homes in the area
Home Values in the Area
Average Home Value in this Area
Purchase History
| Date | Buyer | Sale Price | Title Company |
|---|---|---|---|
| Fayloga Wall Belma | -- | Fam | |
| Fayloga Wall Belma | -- | Fam | |
| Fayloga Wall Belma | $708,000 | Fam | |
| Hale Kevin Demingo | $455,700 | Tg |
Source: Public Records
Mortgage History
| Date | Status | Borrower | Loan Amount |
|---|---|---|---|
| Open | Fayloga Wall Belma | $510,000 | |
| Closed | Fayloga Wall Belma | $510,000 | |
| Previous Owner | Hale Kevin Demingo | $364,520 |
Source: Public Records
Tax History Compared to Growth
Tax History
| Year | Tax Paid | Tax Assessment Tax Assessment Total Assessment is a certain percentage of the fair market value that is determined by local assessors to be the total taxable value of land and additions on the property. | Land | Improvement |
|---|---|---|---|---|
| 2025 | $2,087 | $725,400 | $344,600 | $380,800 |
| 2024 | $2,087 | $716,200 | $331,300 | $384,900 |
| 2023 | $1,855 | $729,900 | $331,300 | $398,600 |
| 2022 | $2,054 | $686,800 | $318,100 | $368,700 |
| 2021 | $1,647 | $570,700 | $318,100 | $252,600 |
| 2020 | $1,591 | $554,500 | $318,100 | $236,400 |
| 2019 | $1,797 | $593,500 | $291,600 | $301,900 |
| 2018 | $1,649 | $551,000 | $238,600 | $312,400 |
| 2017 | $1,473 | $500,900 | $180,200 | $320,700 |
| 2016 | $1,319 | $456,800 | $169,600 | $287,200 |
| 2015 | $1,249 | $436,800 | $164,300 | $272,500 |
| 2014 | $951 | $395,600 | $167,200 | $228,400 |
Source: Public Records
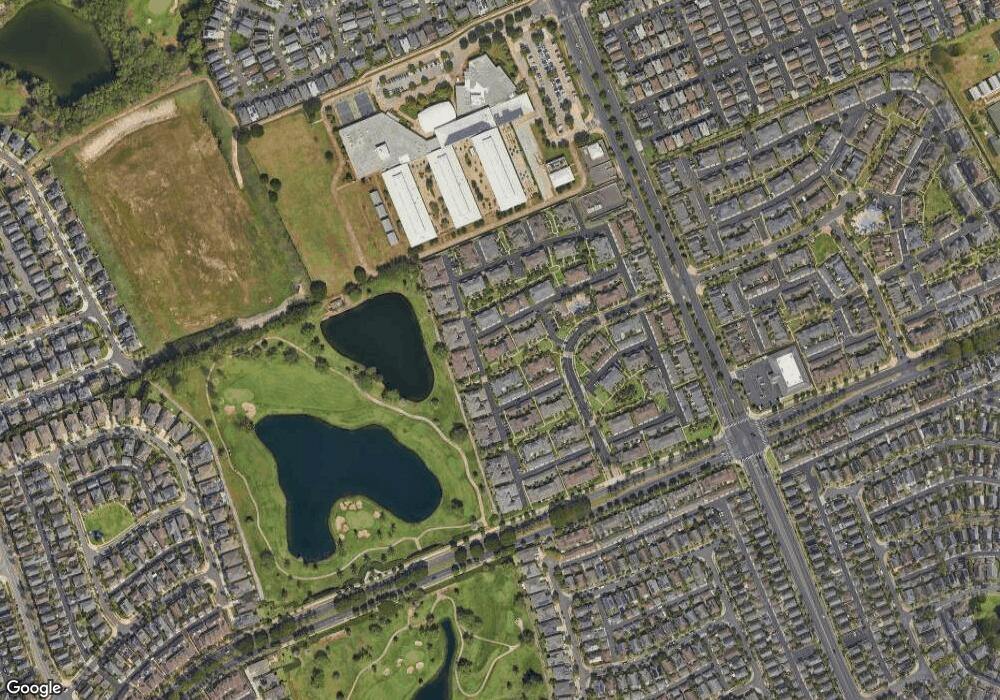
Map
Nearby Homes
- 91-2083 Kaioli St Unit 1303
- 91-2123 Kaioli St Unit 3001
- 91-2070 Kaioli St Unit 4403
- 91-2071 Kaioli St Unit 701
- 91-2091 Kaioli St Unit 1602
- 91-1211 Keoneula Blvd Unit 2D5
- 91-6417 Kapolei Pkwy
- 91-2017 Kaioli St Unit 4102
- 91-2032 Kaioli St Unit 6006
- 91-1040 Waikapuna St
- 91-1033 Kaipalaoa St Unit 1402
- 91-1153 Kaileonui St
- 91-1312 Keoneula Blvd Unit 203
- 91-1013 Waiemi St
- 91-1121 Keoneula Blvd Unit L5
- 91-1027 Kaipalaoa St Unit 1103
- 91-1022 Waiilikahi St
- 91-1001 Keaunui Dr Unit 136
- 91-1001 Keaunui Dr Unit 111
- 91-1001 Keaunui Dr Unit 35
- 91-2105 Kaioli St Unit 232305
- 91-2105 Kaioli St Unit 23
- 91-2103 Kaioli St Unit 222205
- 91-2103 Kaioli St Unit 22
- 91-2105 Kaioli St Unit 232302
- 91-2105 Kaioli St Unit 232301
- 91-2103 Kaioli St Unit 222201
- 91-2103 Kaioli St Unit 222204
- 91-2105 Kaioli St Unit 232304
- 91-2105 Kaioli St Unit 2302
- 91-2103 Kaioli St Unit 2203
- 91-2103 Kaioli St Unit 2201
- 91-2103 Kaioli St Unit 2204
- 91-2105 Kaioli St Unit 2305
- 91-2105 Kaioli St Unit 2303
- 91 Kaioli St
- 91-2111 Kai 'Oli St Unit 242402
- 91-2105 Kai 'Oli St Unit 2303
- 91-2105 Kaioli St Unit 2305
- 91-2076 Kai 'Oli St Unit 3803