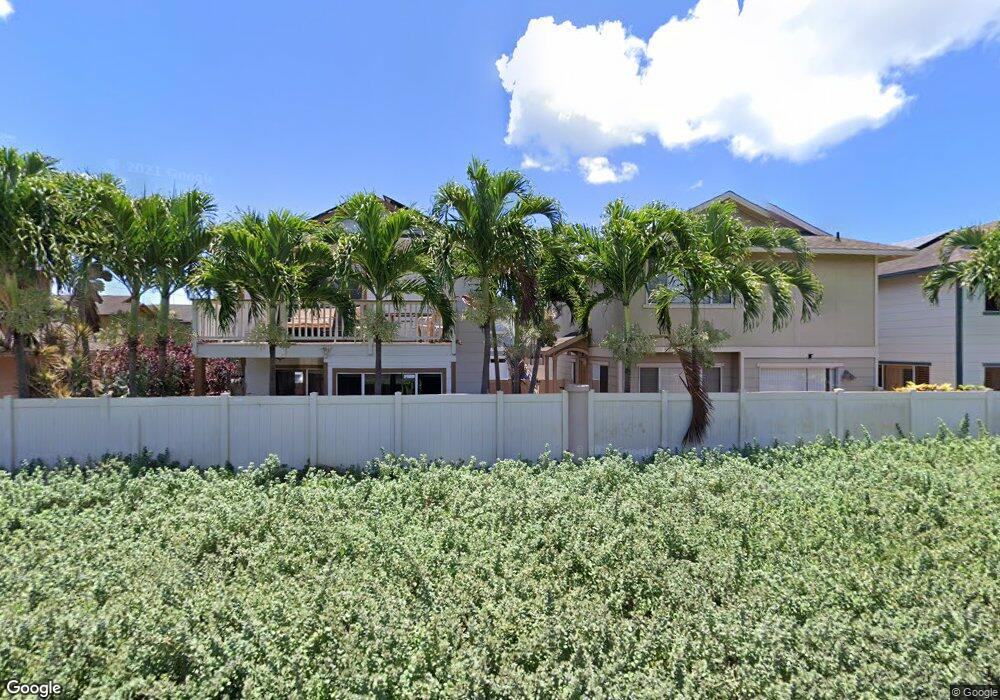
91-278 Makalea St Unit 22 Ewa Beach, HI 96706
Estimated Value: $703,268 - $784,000
3
Beds
2
Baths
1,146
Sq Ft
$646/Sq Ft
Est. Value
About This Home
This home is located at 91-278 Makalea St Unit 22, Ewa Beach, HI 96706 and is currently estimated at $740,567, approximately $646 per square foot. 91-278 Makalea St Unit 22 is a home located in Honolulu County with nearby schools including Holomua Elementary School, Ilima Intermediate School, and James Campbell High School.
Ownership History
Date
Name
Owned For
Owner Type
Purchase Details
Closed on
Jul 8, 2014
Sold by
Rose Micahel Anthony and Rose Naomi Sato
Bought by
Rose Michael Anthony
Current Estimated Value
Purchase Details
Closed on
Sep 23, 2005
Sold by
Bereza Joseph Robert and Rereza Shawkate Lashun
Bought by
Rose Michael Anthony and Rose Naomi Sato
Home Financials for this Owner
Home Financials are based on the most recent Mortgage that was taken out on this home.
Original Mortgage
$431,000
Outstanding Balance
$228,699
Interest Rate
5.72%
Mortgage Type
Fannie Mae Freddie Mac
Estimated Equity
$511,868
Purchase Details
Closed on
Mar 18, 2003
Sold by
Gentry Homes Ltd
Bought by
Bereza Joseph Robert and Bereza Shawkate Lashun
Home Financials for this Owner
Home Financials are based on the most recent Mortgage that was taken out on this home.
Original Mortgage
$221,200
Interest Rate
5.82%
Mortgage Type
VA
Create a Home Valuation Report for This Property
The Home Valuation Report is an in-depth analysis detailing your home's value as well as a comparison with similar homes in the area
Home Values in the Area
Average Home Value in this Area
Purchase History
| Date | Buyer | Sale Price | Title Company |
|---|---|---|---|
| Rose Michael Anthony | -- | Accommodation | |
| Rose Michael Anthony | -- | Accommodation | |
| Rose Michael Anthony | $431,000 | Fat | |
| Bereza Joseph Robert | $216,900 | -- |
Source: Public Records
Mortgage History
| Date | Status | Borrower | Loan Amount |
|---|---|---|---|
| Open | Rose Michael Anthony | $431,000 | |
| Previous Owner | Bereza Joseph Robert | $221,200 |
Source: Public Records
Tax History Compared to Growth
Tax History
| Year | Tax Paid | Tax Assessment Tax Assessment Total Assessment is a certain percentage of the fair market value that is determined by local assessors to be the total taxable value of land and additions on the property. | Land | Improvement |
|---|---|---|---|---|
| 2025 | $2,104 | $744,800 | $498,100 | $246,700 |
| 2024 | $2,104 | $721,000 | $480,900 | $240,100 |
| 2023 | $1,994 | $769,700 | $515,300 | $254,400 |
| 2022 | $1,828 | $622,300 | $478,500 | $143,800 |
| 2021 | $1,555 | $544,300 | $322,500 | $221,800 |
| 2020 | $1,595 | $555,700 | $322,900 | $232,800 |
| 2019 | $1,685 | $561,300 | $333,200 | $228,100 |
| 2018 | $1,583 | $532,200 | $322,900 | $209,300 |
| 2017 | $1,377 | $473,300 | $240,500 | $232,800 |
| 2016 | $1,218 | $428,100 | $240,500 | $187,600 |
| 2015 | $1,126 | $401,700 | $123,400 | $278,300 |
| 2014 | $944 | $381,700 | $133,500 | $248,200 |
Source: Public Records
Map
Nearby Homes
- 91-292 Makalea St Unit 29
- 91-280 Makalea St Unit 23
- 91-318 Makalea St Unit 42
- 91-338 Makalea St Unit 52
- 91-1014 Laulauna St Unit 125
- 91-1018 Laulauna St Unit 124
- 91-1011 Laulauna St Unit 136
- 91-380 Makalea St Unit 73
- 91-1028 Laulauna St Unit 9
- 91-422 Makalea St Unit 94
- 91-1040 Komoaina St Unit 73
- 91-3066 Makalea Loop Unit 53
- 91-1042 Hoomaka St Unit 12
- 91-1040 Hoomaka St Unit 16
- 91-297 Makalauna Place Unit 1
- 91-466 Makalea St Unit 112
- 91-1857 Luahoana St Unit 126
- 91-526 Makalea St Unit 146
- 91-1010 Huliau St Unit 5C
- 91 Laupai St
- 91-276 Makalea St Unit 21
- 91-276-276 Makalea St
- 91-264 Makalea St Unit 13
- 91-290 Makalea St Unit 28
- 91-266 Makalea St Unit 14
- 91-274 Makalea St Unit 20
- 91-262 Makalea St Unit 12
- 91-268 Makalea St Unit 15
- 91-288 Makalea St Unit 27
- 91-294 Makalea St Unit 30
- 91-272 Makalea St Unit 19
- 91-284 Makalea St Unit 25
- 91-286 Makalea St Unit 26
- 91-270 Makalea St Unit 16
- 91-260 Makalea St Unit 11
- 91-296 Makalea St Unit 31
- 91-252 Makalea St Unit 7
- 91-250 Makalea St Unit 6
- 91-300 Makalea St Unit 33
- 91-258 Makalea St Unit 10