P
Seller's Agent in 2025
Priscilla Walthouse
Coldwell Banker Realty
(808) 735-4200
6 in this area
58 Total Sales
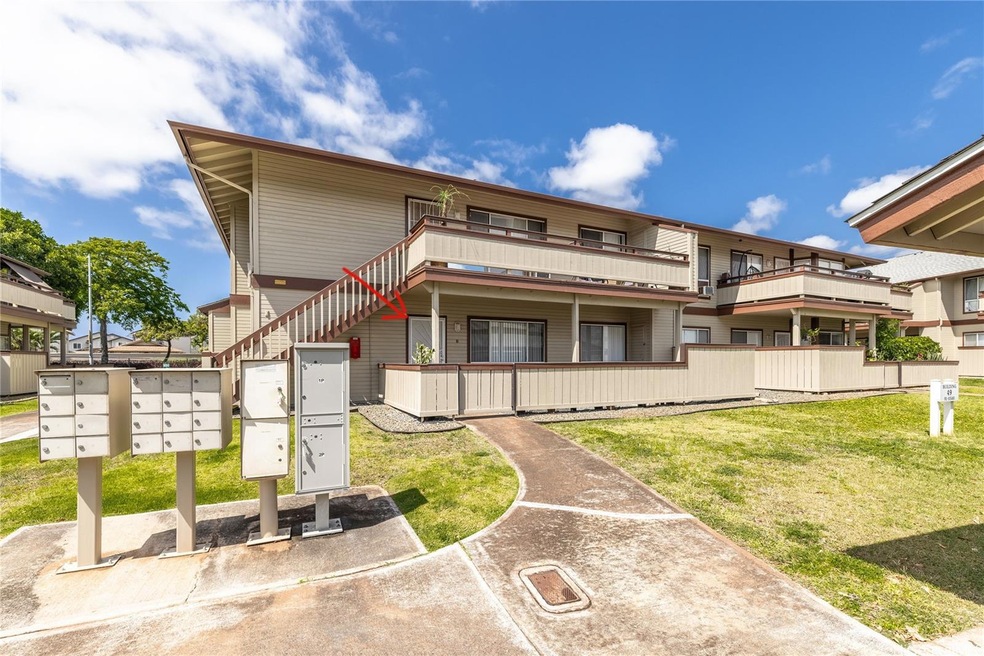
Welcome home to this GROUND FLOOR unit in the gated Palm Court community. This unit has been tastefully upgraded with vinyl flooring, wooden shaker cabinets, quartz counter tops, window unit AC, and much more! A spacious covered lanai provides an ideal place to relax with your family & friends. Enjoy resort like amenities that include a pool and BBQ grills. Conveniently located near The Queens Medical Center - West Oahu, UH West Oahu, and Ka Makana Alii Shopping Center.
Last Agent to Sell the Property
Coldwell Banker Island Prop License #RB-22059 Listed on: 06/10/2024

| Date | Status | Loan Amount | Loan Type |
|---|---|---|---|
| Closed | $183,418 | New Conventional |
| Date | Event | Price | Change | Sq Ft Price |
|---|---|---|---|---|
| 09/10/2025 09/10/25 | Price Changed | $529,000 | -4.7% | $653 / Sq Ft |
| 09/05/2025 09/05/25 | For Sale | $555,000 | +6.3% | $685 / Sq Ft |
| 04/10/2025 04/10/25 | Sold | $522,000 | -4.7% | $644 / Sq Ft |
| 01/30/2025 01/30/25 | Sold | $547,700 | -0.4% | $627 / Sq Ft |
| 01/01/2025 01/01/25 | Price Changed | $550,000 | 0.0% | $629 / Sq Ft |
| 12/14/2024 12/14/24 | Rented | $3,000 | 0.0% | -- |
| 12/03/2024 12/03/24 | For Sale | $545,000 | 0.0% | $624 / Sq Ft |
| 11/17/2024 11/17/24 | Price Changed | $2,900 | 0.0% | $4 / Sq Ft |
| 10/25/2024 10/25/24 | Price Changed | $520,000 | 0.0% | $642 / Sq Ft |
| 10/21/2024 10/21/24 | For Rent | $3,000 | 0.0% | -- |
| 10/02/2024 10/02/24 | Sold | $545,000 | +3.8% | $673 / Sq Ft |
| 09/20/2024 09/20/24 | For Sale | $525,000 | -1.9% | $648 / Sq Ft |
| 07/20/2024 07/20/24 | Price Changed | $535,000 | -2.7% | $660 / Sq Ft |
| 06/10/2024 06/10/24 | For Sale | $550,000 | 0.0% | $679 / Sq Ft |
| 11/03/2023 11/03/23 | Sold | $550,000 | 0.0% | $679 / Sq Ft |
| 11/03/2023 11/03/23 | Off Market | $550,000 | -- | -- |
| 10/06/2023 10/06/23 | Pending | -- | -- | -- |
| 09/14/2023 09/14/23 | For Sale | $539,000 | -4.2% | $665 / Sq Ft |
| 10/01/2022 10/01/22 | Off Market | $562,500 | -- | -- |
| 09/30/2022 09/30/22 | Sold | $562,500 | +7.1% | $644 / Sq Ft |
| 08/20/2022 08/20/22 | Pending | -- | -- | -- |
| 08/10/2022 08/10/22 | Off Market | $525,000 | -- | -- |
| 08/10/2022 08/10/22 | For Sale | $575,000 | +9.5% | $658 / Sq Ft |
| 08/08/2022 08/08/22 | Sold | $525,000 | -2.8% | $648 / Sq Ft |
| 06/20/2022 06/20/22 | Pending | -- | -- | -- |
| 06/02/2022 06/02/22 | For Sale | $540,000 | +8.0% | $667 / Sq Ft |
| 11/24/2021 11/24/21 | Sold | $500,000 | 0.0% | $617 / Sq Ft |
| 10/25/2021 10/25/21 | For Sale | $500,000 | +11.1% | $617 / Sq Ft |
| 05/26/2021 05/26/21 | Sold | $450,000 | 0.0% | $556 / Sq Ft |
| 04/26/2021 04/26/21 | Pending | -- | -- | -- |
| 04/21/2021 04/21/21 | For Sale | $450,000 | +21.6% | $556 / Sq Ft |
| 06/26/2019 06/26/19 | Sold | $370,000 | -6.6% | $457 / Sq Ft |
| 05/27/2019 05/27/19 | Pending | -- | -- | -- |
| 05/08/2019 05/08/19 | Sold | $396,000 | +2.9% | $453 / Sq Ft |
| 04/23/2019 04/23/19 | For Sale | $385,000 | -3.5% | $475 / Sq Ft |
| 04/08/2019 04/08/19 | Pending | -- | -- | -- |
| 03/12/2019 03/12/19 | For Sale | $399,000 | +3.6% | $457 / Sq Ft |
| 08/09/2018 08/09/18 | Sold | $385,000 | +1.3% | $475 / Sq Ft |
| 07/10/2018 07/10/18 | Pending | -- | -- | -- |
| 06/12/2018 06/12/18 | For Sale | $380,000 | -4.0% | $469 / Sq Ft |
| 03/09/2018 03/09/18 | Sold | $396,000 | +7.0% | $489 / Sq Ft |
| 02/07/2018 02/07/18 | Pending | -- | -- | -- |
| 01/04/2018 01/04/18 | For Sale | $370,000 | +20.1% | $457 / Sq Ft |
| 06/15/2015 06/15/15 | Sold | $308,000 | -3.8% | $380 / Sq Ft |
| 05/16/2015 05/16/15 | Pending | -- | -- | -- |
| 02/15/2015 02/15/15 | For Sale | $320,000 | -- | $395 / Sq Ft |
| Year | Tax Paid | Tax Assessment Tax Assessment Total Assessment is a certain percentage of the fair market value that is determined by local assessors to be the total taxable value of land and additions on the property. | Land | Improvement |
|---|---|---|---|---|
| 2025 | $1,263 | $538,300 | $230,800 | $307,500 |
| 2024 | $1,263 | $520,800 | $221,900 | $298,900 |
| 2023 | $1,150 | $568,500 | $221,900 | $346,600 |
| 2022 | $1,117 | $459,100 | $213,000 | $246,100 |
| 2021 | $935 | $407,000 | $213,000 | $194,000 |
| 2020 | $894 | $395,400 | $213,000 | $182,400 |
| 2019 | $1,013 | $409,500 | $195,300 | $214,200 |
| 2018 | $917 | $382,000 | $159,800 | $222,200 |
| 2017 | $713 | $323,800 | $120,700 | $203,100 |
| 2016 | $679 | $313,900 | $113,600 | $200,300 |
| 2015 | $633 | $300,900 | $110,000 | $190,900 |
| 2014 | $418 | $277,800 | $135,500 | $142,300 |
P
Seller's Agent in 2025
Priscilla Walthouse
Coldwell Banker Realty
(808) 735-4200
6 in this area
58 Total Sales
M
Seller's Agent in 2025
Michael Yoshino
Coldwell Banker Realty
C
Seller's Agent in 2025
Courtney Williams
Hawaii Pacific Realty Group
(808) 223-4421
138 in this area
309 Total Sales
J
Seller Co-Listing Agent in 2025
Jade Roach
Coldwell Banker Realty
(808) 735-4200
8 in this area
56 Total Sales
K
Buyer's Agent in 2025
Kendra Atienza
HB Homes INC
(808) 497-7311
174 in this area
410 Total Sales
D
Seller's Agent in 2024
Derek Kamm
Coldwell Banker Island Prop
(808) 800-7308
22 in this area
262 Total Sales
Source: HiCentral MLS (Honolulu Board of REALTORS®)
MLS Number: 202413726
APN: 1-9-1-061-019-0017
Disclaimer: Certain information contained herein is derived from information provided by parties other than Homes.com. All information provided is deemed reliable, but is not guaranteed to be accurate and should be independently verified.
![]() Some of the active listings appearing on this site may be listed by other REALTORS(R). If you are interested in those active listings, our company may represent you as the buyer's agent. If the active listing you are interested in is our company's active listing, you may speak to one of our agents regarding your options for representation.
Some of the active listings appearing on this site may be listed by other REALTORS(R). If you are interested in those active listings, our company may represent you as the buyer's agent. If the active listing you are interested in is our company's active listing, you may speak to one of our agents regarding your options for representation.
Based on information from the Multiple Listing Service of HiCentral MLS, Ltd. Information is deemed reliable but not guaranteed. Copyright 2025 HiCentral MLS, Ltd