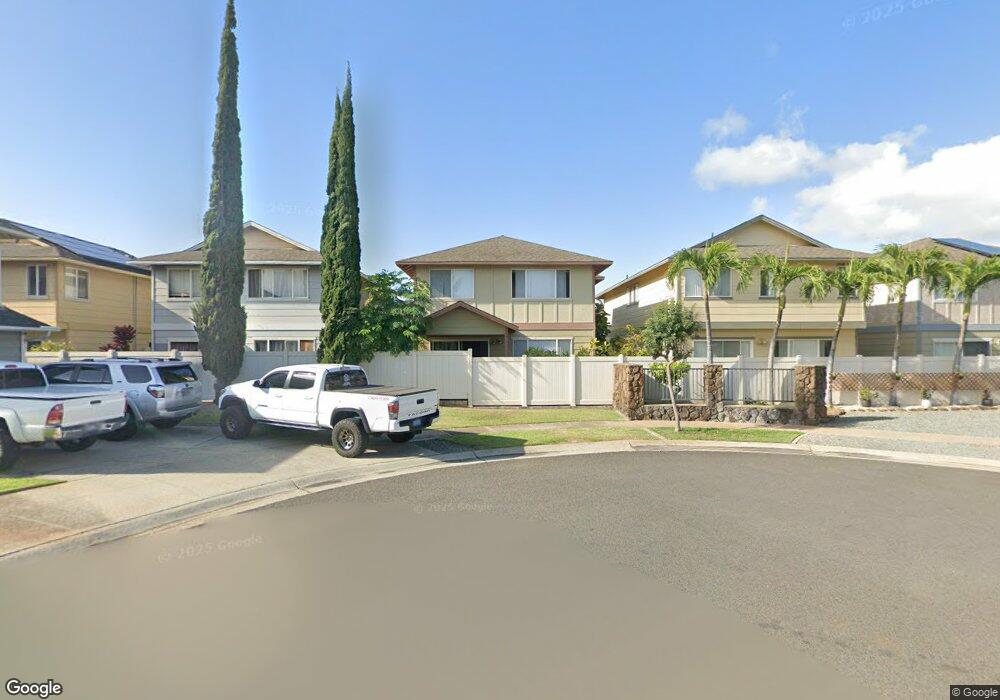
91-728 Makalea St Unit 101 Ewa Beach, HI 96706
Estimated Value: $852,000 - $982,000
5
Beds
3
Baths
1,640
Sq Ft
$550/Sq Ft
Est. Value
About This Home
This home is located at 91-728 Makalea St Unit 101, Ewa Beach, HI 96706 and is currently estimated at $901,470, approximately $549 per square foot. 91-728 Makalea St Unit 101 is a home located in Honolulu County with nearby schools including Holomua Elementary School, Ilima Intermediate School, and James Campbell High School.
Ownership History
Date
Name
Owned For
Owner Type
Purchase Details
Closed on
Feb 24, 2016
Sold by
Cumberlander Rubus and Cumberlander Celine Laakea
Bought by
The Rufus Cumberlander Revocable Trust and Cumberlander Celine
Current Estimated Value
Home Financials for this Owner
Home Financials are based on the most recent Mortgage that was taken out on this home.
Original Mortgage
$176,300
Outstanding Balance
$76,544
Interest Rate
3.81%
Mortgage Type
VA
Estimated Equity
$824,926
Purchase Details
Closed on
Jan 24, 2015
Sold by
Cumberlander Rufus and Cumberlander Celine Laakea
Bought by
Rufus Cumberlander Revocable Trust and Cumberlander Celine
Purchase Details
Closed on
Dec 15, 2003
Sold by
Gentry Homes Ltd
Bought by
Cumberlander Rufus and Cumberlander Celine Laakea
Home Financials for this Owner
Home Financials are based on the most recent Mortgage that was taken out on this home.
Original Mortgage
$284,950
Interest Rate
5.97%
Mortgage Type
VA
Create a Home Valuation Report for This Property
The Home Valuation Report is an in-depth analysis detailing your home's value as well as a comparison with similar homes in the area
Home Values in the Area
Average Home Value in this Area
Purchase History
| Date | Buyer | Sale Price | Title Company |
|---|---|---|---|
| The Rufus Cumberlander Revocable Trust | -- | Fam | |
| Cumberlander Rufus | -- | Fam | |
| The Rufus Cumberlander Revocable Trust | -- | Fam | |
| Cumberlander Rufus | -- | Fam | |
| Rufus Cumberlander Revocable Trust | -- | None Available | |
| Rufus Cumberlander Revocable Trust | -- | None Available | |
| Cumberlander Rufus | $294,500 | -- |
Source: Public Records
Mortgage History
| Date | Status | Borrower | Loan Amount |
|---|---|---|---|
| Open | Cumberlander Rufus | $176,300 | |
| Closed | Cumberlander Rufus | $176,300 | |
| Closed | Cumberlander Rufus | $284,950 |
Source: Public Records
Tax History Compared to Growth
Tax History
| Year | Tax Paid | Tax Assessment Tax Assessment Total Assessment is a certain percentage of the fair market value that is determined by local assessors to be the total taxable value of land and additions on the property. | Land | Improvement |
|---|---|---|---|---|
| 2025 | $2,651 | $870,000 | $542,500 | $327,500 |
| 2024 | $2,651 | $877,300 | $523,800 | $353,500 |
| 2023 | $2,398 | $898,600 | $561,200 | $337,400 |
| 2022 | $2,398 | $785,200 | $499,700 | $285,500 |
| 2021 | $1,973 | $663,600 | $336,700 | $326,900 |
| 2020 | $1,901 | $643,000 | $351,700 | $291,300 |
| 2019 | $2,080 | $674,300 | $362,900 | $311,400 |
| 2018 | $2,001 | $651,600 | $351,700 | $299,900 |
| 2017 | $1,755 | $581,500 | $261,900 | $319,600 |
| 2016 | $1,576 | $530,200 | $261,900 | $268,300 |
| 2015 | $1,482 | $503,300 | $212,900 | $290,400 |
| 2014 | $1,173 | $484,900 | $191,600 | $293,300 |
Source: Public Records
Map
Nearby Homes
- 91-1860 Luahoana St Unit 114
- 91-698 Makalea St Unit 118
- 91-632 Makalea St Unit 76
- 91-297 Makalauna Place Unit 1
- 91-1857 Luahoana St Unit 126
- 91-919 Hoomohalu Place
- 91-1040 Komoaina St Unit 73
- 91-307 Hoomalule Place
- 91-3066 Makalea Loop Unit 53
- 91-1197 Kanela St Unit M40
- 91-422 Makalea St Unit 94
- 91-1183 Kanela St Unit M47
- 91-1205 Kanela St Unit M36
- 91-380 Makalea St Unit 73
- 91-466 Makalea St Unit 112
- 91-338 Makalea St Unit 52
- 91-1151 Kanela St Unit M3
- 91-318 Makalea St Unit 42
- 91-1200 Keaunui Dr Unit 7
- 91-1200 Keaunui Dr Unit 208
- 91-730 Makalea St Unit 102
- 91-726 Makalea St Unit 100
- 91-724 Makalea St Unit 99
- 91-722 Makalea St Unit 98
- 91-650 Makalea St Unit 110
- 91-652 Makalea St Unit 109
- 91-654 Makalea St Unit 108
- 91-720 Makalea St Unit 97
- 91 Makalea St Unit 32
- 91 Makalea St
- 91-648 Makalea St Unit 111
- 91-656 Makalea St Unit 107
- 91-646 Makalea St Unit 112
- 91-706 Makalea St Unit 90
- 91-708 Makalea St Unit 91
- 91-718 Makalea St Unit 96
- 91-658 Makalea St Unit 106
- 91-710 Makalea St Unit 92
- 91-1852 Luahoana St Unit 116
- 91-644 Makalea St Unit 113