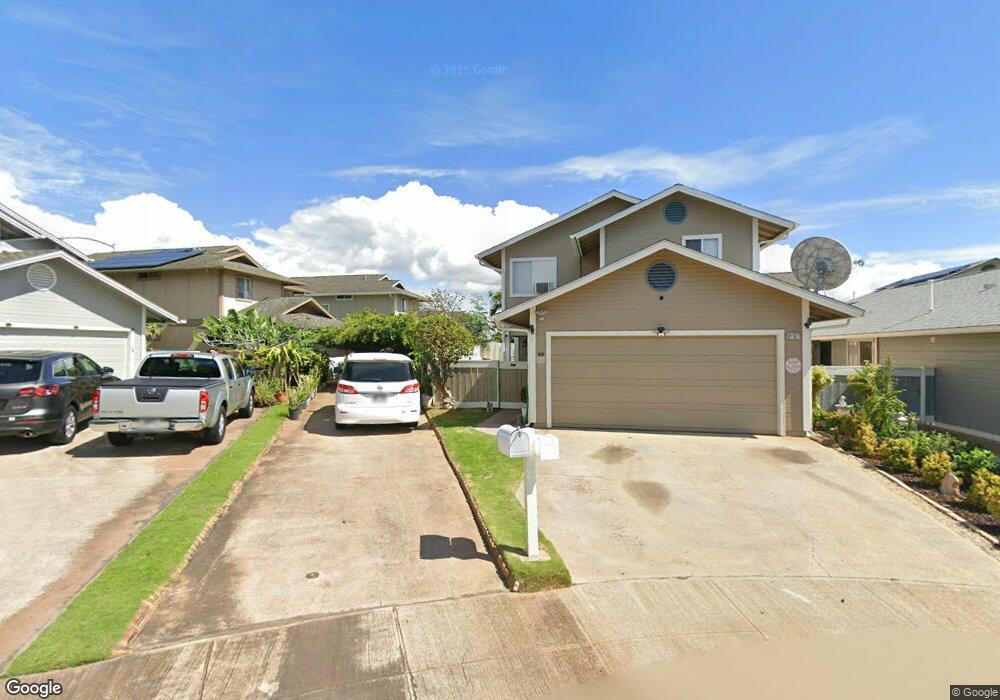
91-927 Nohoihoewa Place Ewa Beach, HI 96706
Estimated Value: $858,904 - $874,000
3
Beds
3
Baths
1,501
Sq Ft
$577/Sq Ft
Est. Value
About This Home
This home is located at 91-927 Nohoihoewa Place, Ewa Beach, HI 96706 and is currently estimated at $866,476, approximately $577 per square foot. 91-927 Nohoihoewa Place is a home located in Honolulu County with nearby schools including Keoneula Elementary School, Ewa Makai Middle School, and James Campbell High School.
Ownership History
Date
Name
Owned For
Owner Type
Purchase Details
Closed on
Sep 19, 2003
Sold by
Johnson Clinton Kevin and Johnson Giselda Niccoli
Bought by
Richmond Christopher Dale and Richmond Kathleen Keiko
Current Estimated Value
Home Financials for this Owner
Home Financials are based on the most recent Mortgage that was taken out on this home.
Original Mortgage
$228,000
Outstanding Balance
$105,260
Interest Rate
6.17%
Mortgage Type
Unknown
Estimated Equity
$761,216
Purchase Details
Closed on
Mar 20, 2003
Sold by
Cachero Pedro Pulanco and Cachero Adoracion Simon
Bought by
Johnson Clinton Kevin and Johnson Giselda Niccoli
Home Financials for this Owner
Home Financials are based on the most recent Mortgage that was taken out on this home.
Original Mortgage
$150,000
Interest Rate
5.82%
Create a Home Valuation Report for This Property
The Home Valuation Report is an in-depth analysis detailing your home's value as well as a comparison with similar homes in the area
Home Values in the Area
Average Home Value in this Area
Purchase History
| Date | Buyer | Sale Price | Title Company |
|---|---|---|---|
| Richmond Christopher Dale | $285,000 | -- | |
| Johnson Clinton Kevin | $268,000 | -- |
Source: Public Records
Mortgage History
| Date | Status | Borrower | Loan Amount |
|---|---|---|---|
| Open | Richmond Christopher Dale | $228,000 | |
| Previous Owner | Johnson Clinton Kevin | $150,000 |
Source: Public Records
Tax History Compared to Growth
Tax History
| Year | Tax Paid | Tax Assessment Tax Assessment Total Assessment is a certain percentage of the fair market value that is determined by local assessors to be the total taxable value of land and additions on the property. | Land | Improvement |
|---|---|---|---|---|
| 2025 | $2,911 | $819,900 | $585,800 | $234,100 |
| 2024 | $2,911 | $831,600 | $585,800 | $245,800 |
| 2023 | $2,946 | $841,700 | $599,200 | $242,500 |
| 2022 | $2,662 | $760,500 | $532,600 | $227,900 |
| 2021 | $2,314 | $661,200 | $392,800 | $268,400 |
| 2020 | $2,179 | $622,700 | $399,400 | $223,300 |
| 2019 | $2,264 | $646,900 | $399,400 | $247,500 |
| 2018 | $2,113 | $603,600 | $368,300 | $235,300 |
| 2017 | $2,018 | $576,600 | $286,300 | $290,300 |
| 2016 | $1,824 | $521,100 | $273,000 | $248,100 |
| 2015 | $1,843 | $526,600 | $269,000 | $257,600 |
| 2014 | -- | $486,100 | $228,600 | $257,500 |
Source: Public Records
Map
Nearby Homes
- 91-247 Lukini Place Unit 31
- 91-285 Hanapouli Cir Unit 9G
- 91-284 Hanapouli Cir Unit 7
- 91-291 Hanapouli Cir Unit 4
- 91-289 Hanapouli Cir Unit 5
- 91-299 Hanapouli Cir Unit 1C
- 91-738 Launahele St Unit 66
- 91-1197 Kamoawa St
- 91-1196 Lukahiu Place
- 91-1217 Kaneana St Unit 14I
- 91-1201 Kaneana St Unit 1H
- 91-1213 Kaneana St Unit 12
- 91-1209 Kaneana St Unit 7
- 91-772 Launahele St Unit 99
- 91-1173 Pekau St
- 91-1145 Laaulu St Unit 12
- 91-1088 Laaulu St Unit 18
- 91-1032 Kamaehu St
- 91-535 Pohakupili Place
- 91-313 Hoalauna Place
- 91-925 Nohoihoewa Place
- 91-929 Nohoihoewa Place
- 91-936 Kuaeewa Place
- 91-923 Nohoihoewa Place
- 91-940 Kuaeewa Place
- 91-932 Nohoihoewa Place
- 91-934 Kuaeewa Place
- 91-942 Kuaeewa Place
- 91-930 Nohoihoewa Place
- 91-921 Nohoihoewa Place
- 91-926 Nohoihoewa Place
- 91-930 Kuaeewa Place
- 91-924 Nohoihoewa Place
- 91-928 Nohoihoewa Place
- 91-944 Kuaeewa Place
- 91-917 Nohoihoewa Place
- 91-920 Nohoihoewa Place
- 91-928 Kuaeewa Place
- 91-943 Kuaeewa Place
- 91-137 Nohoihoewa Way