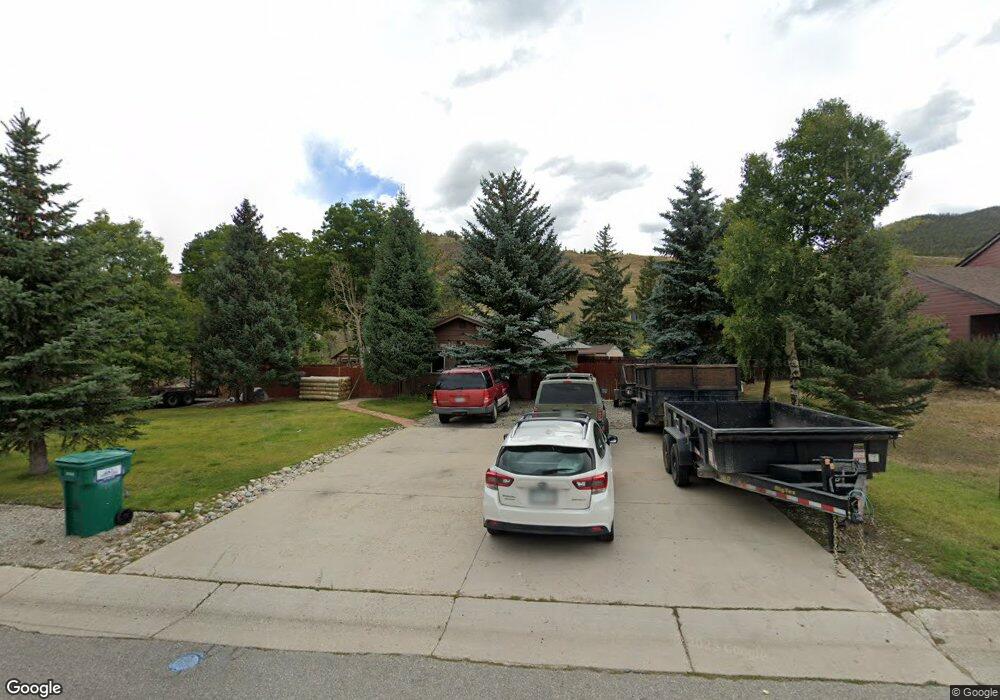
91 Alpine Rd Dillon, CO 80435
Estimated Value: $730,000 - $1,017,000
3
Beds
2
Baths
1,178
Sq Ft
$712/Sq Ft
Est. Value
About This Home
This home is located at 91 Alpine Rd, Dillon, CO 80435 and is currently estimated at $838,621, approximately $711 per square foot. 91 Alpine Rd is a home with nearby schools including Dillon Valley Elementary School, Summit Middle School, and Summit High School.
Ownership History
Date
Name
Owned For
Owner Type
Purchase Details
Closed on
Dec 27, 2007
Sold by
Delara Abraham
Bought by
Delara Abraham and Delara Josefina F
Current Estimated Value
Home Financials for this Owner
Home Financials are based on the most recent Mortgage that was taken out on this home.
Original Mortgage
$316,000
Outstanding Balance
$199,601
Interest Rate
6.26%
Mortgage Type
New Conventional
Estimated Equity
$639,020
Purchase Details
Closed on
Dec 21, 2007
Sold by
Gallegos Juan M and Gallegos Carmen
Bought by
Delara Abraham
Home Financials for this Owner
Home Financials are based on the most recent Mortgage that was taken out on this home.
Original Mortgage
$316,000
Outstanding Balance
$199,601
Interest Rate
6.26%
Mortgage Type
New Conventional
Estimated Equity
$639,020
Purchase Details
Closed on
Jul 7, 2006
Sold by
Ting Hak Keung
Bought by
Gallegos Juan M and Gallegos Carmen
Home Financials for this Owner
Home Financials are based on the most recent Mortgage that was taken out on this home.
Original Mortgage
$225,600
Interest Rate
6.67%
Mortgage Type
New Conventional
Create a Home Valuation Report for This Property
The Home Valuation Report is an in-depth analysis detailing your home's value as well as a comparison with similar homes in the area
Home Values in the Area
Average Home Value in this Area
Purchase History
| Date | Buyer | Sale Price | Title Company |
|---|---|---|---|
| Delara Abraham | -- | None Available | |
| Delara Abraham | $316,000 | Land Title Guarantee Company | |
| Gallegos Juan M | $282,000 | Land Title Guarantee Company |
Source: Public Records
Mortgage History
| Date | Status | Borrower | Loan Amount |
|---|---|---|---|
| Open | Delara Abraham | $316,000 | |
| Previous Owner | Gallegos Juan M | $225,600 |
Source: Public Records
Tax History
| Year | Tax Paid | Tax Assessment Tax Assessment Total Assessment is a certain percentage of the fair market value that is determined by local assessors to be the total taxable value of land and additions on the property. | Land | Improvement |
|---|---|---|---|---|
| 2024 | $2,270 | $45,707 | -- | -- |
| 2023 | $2,270 | $42,022 | $0 | $0 |
| 2022 | $1,869 | $32,714 | $0 | $0 |
| 2021 | $1,885 | $33,655 | $0 | $0 |
| 2020 | $1,528 | $29,144 | $0 | $0 |
| 2019 | $1,507 | $29,144 | $0 | $0 |
| 2018 | $1,282 | $24,015 | $0 | $0 |
| 2017 | $1,172 | $24,015 | $0 | $0 |
| 2016 | $1,112 | $22,442 | $0 | $0 |
| 2015 | $1,078 | $22,442 | $0 | $0 |
| 2014 | $974 | $20,029 | $0 | $0 |
| 2013 | -- | $20,029 | $0 | $0 |
Source: Public Records
Map
Nearby Homes
- 390 Straight Creek Dr Unit 307
- 490 Straight Creek Dr Unit 520
- 305 Straight Creek Dr Unit A
- 535 Straight Creek Dr Unit D104
- 127 Cr 76
- 897 Deer Path Rd
- 9 Crown Ct
- 9 Crown Ct Unit 2078
- 753 Straight Creek Dr Unit 201
- 370 E La Bonte St Unit A
- 370 E La Bonte St Unit F
- 330 E La Bonte St Unit 2
- 145 Gold Run Cir
- 240 E La Bonte St Unit 35
- 240 E La Bonte St Unit 47
- 235 E La Bonte St Unit 108
- 235 E La Bonte St Unit 106
- 414 Tenderfoot St Unit 16
- 460 Tenderfoot St Unit 110
- 220 E La Bonte St Unit 231
- 91 Alpine Rd Unit apartment
- 71 Alpine Rd
- 111 Alpine Rd
- 92 Alpine Rd
- 92 Alpine Rd
- 72 Alpine Rd
- 51 Alpine Rd
- 112 Alpine Rd
- 131 Alpine Rd
- 52 Alpine Rd
- 0132 Alpine Rd
- 0390 Straight Creek Dr Unit 307
- 151 Alpine Rd
- 93 Big Elk Rd
- 31 Alpine Rd
- 32 Alpine Rd
- 73 Big Elk Rd
- 113 Big Elk Rd
- 53 Big Elk Rd
- 390 Straight Creek Dr Unit 306
Your Personal Tour Guide
Ask me questions while you tour the home.