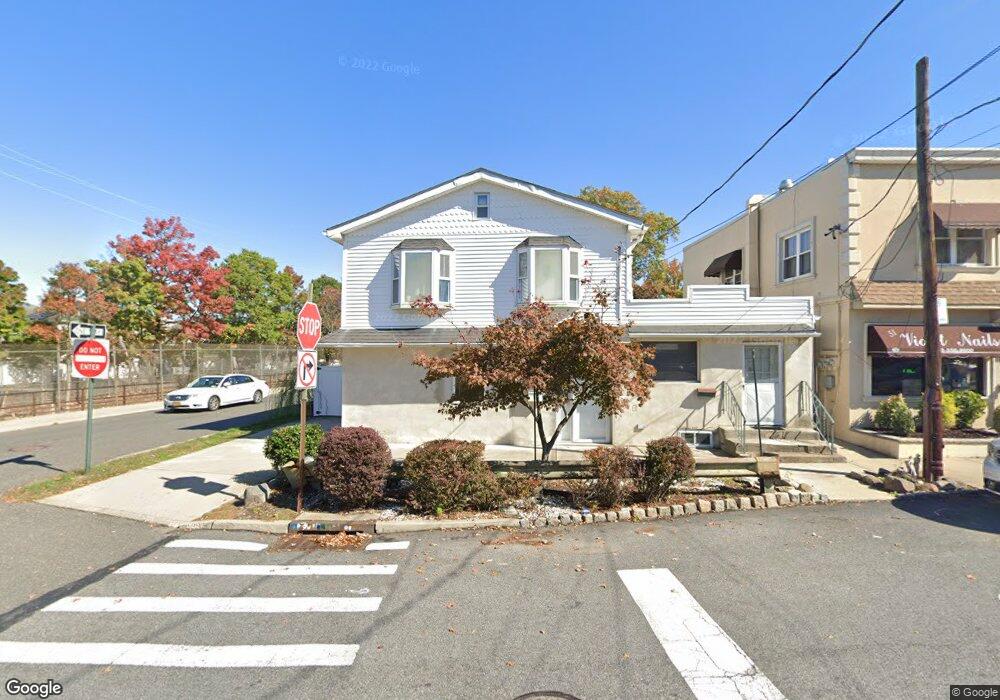
91 Barclay Ave Staten Island, NY 10312
Annadale Neighborhood
--
Bed
--
Bath
2,218
Sq Ft
4,661
Sq Ft Lot
About This Home
This home is located at 91 Barclay Ave, Staten Island, NY 10312. 91 Barclay Ave is a home located in Richmond County with nearby schools including P.S. 55 The Henry M. Boehm School, I.S. 007 Elias Bernstein, and Tottenville High School.
Ownership History
Date
Name
Owned For
Owner Type
Purchase Details
Closed on
Jul 23, 2024
Sold by
Mccalip William and Mccalip Dianne Lynn
Bought by
Mccalip William
Purchase Details
Closed on
Sep 22, 2008
Sold by
Mccalip Diane Lynn
Bought by
Mccalip Diane Lynn and Mccalip William
Home Financials for this Owner
Home Financials are based on the most recent Mortgage that was taken out on this home.
Original Mortgage
$100,000
Interest Rate
6.54%
Mortgage Type
Commercial
Purchase Details
Closed on
Sep 13, 1999
Sold by
Pisano Andrew G and Dibella Joanne
Bought by
Mccalip Diane Lynn
Home Financials for this Owner
Home Financials are based on the most recent Mortgage that was taken out on this home.
Original Mortgage
$100,000
Interest Rate
7.61%
Mortgage Type
Commercial
Purchase Details
Closed on
Nov 19, 1998
Sold by
Pisano Andrew G and Pisano Andrew G
Bought by
Pisano Andrew G and Dibella Joanne
Create a Home Valuation Report for This Property
The Home Valuation Report is an in-depth analysis detailing your home's value as well as a comparison with similar homes in the area
Home Values in the Area
Average Home Value in this Area
Purchase History
| Date | Buyer | Sale Price | Title Company |
|---|---|---|---|
| Mccalip William | -- | None Listed On Document | |
| Mccalip Diane Lynn | -- | The Judicial Title Insurance | |
| Mccalip Diane Lynn | $112,000 | Fidelity National Title Ins | |
| Pisano Andrew G | $57,000 | -- |
Source: Public Records
Mortgage History
| Date | Status | Borrower | Loan Amount |
|---|---|---|---|
| Previous Owner | Mccalip Diane Lynn | $100,000 | |
| Previous Owner | Mccalip Diane Lynn | $100,000 |
Source: Public Records
Tax History Compared to Growth
Tax History
| Year | Tax Paid | Tax Assessment Tax Assessment Total Assessment is a certain percentage of the fair market value that is determined by local assessors to be the total taxable value of land and additions on the property. | Land | Improvement |
|---|---|---|---|---|
| 2025 | $6,107 | $50,700 | $7,132 | $43,568 |
| 2024 | $6,107 | $46,080 | $7,404 | $38,676 |
| 2023 | $5,826 | $28,685 | $6,967 | $21,718 |
| 2022 | $5,726 | $41,340 | $11,280 | $30,060 |
| 2021 | $5,991 | $41,340 | $11,280 | $30,060 |
| 2020 | $5,685 | $41,340 | $11,280 | $30,060 |
| 2019 | $5,008 | $41,340 | $11,280 | $30,060 |
| 2018 | $4,575 | $23,904 | $6,935 | $16,969 |
| 2017 | $4,573 | $23,904 | $7,367 | $16,537 |
| 2016 | $4,433 | $23,723 | $7,770 | $15,953 |
| 2015 | $3,747 | $22,381 | $8,802 | $13,579 |
| 2014 | $3,747 | $21,115 | $9,974 | $11,141 |
Source: Public Records
Map
Nearby Homes