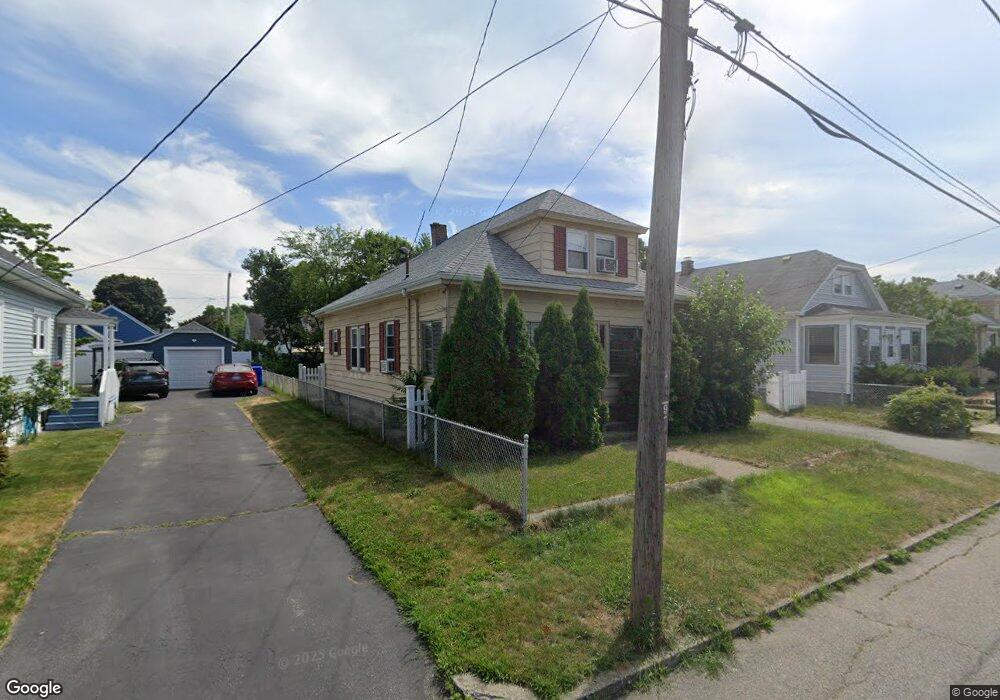
91 Benedict St Pawtucket, RI 02861
Darlington NeighborhoodEstimated Value: $362,000 - $416,000
3
Beds
1
Bath
1,248
Sq Ft
$312/Sq Ft
Est. Value
About This Home
This home is located at 91 Benedict St, Pawtucket, RI 02861 and is currently estimated at $388,879, approximately $311 per square foot. 91 Benedict St is a home located in Providence County with nearby schools including Saint Teresa Catholic Elementary School, St Cecilia School, and Saint Raphael Academy.
Ownership History
Date
Name
Owned For
Owner Type
Purchase Details
Closed on
Jan 28, 2003
Sold by
Coyle Shawn and Coyle Susan M
Bought by
Pfeil Deborah A and Sabourin Stephen E
Current Estimated Value
Purchase Details
Closed on
Feb 14, 1997
Sold by
Otoole Jennie
Bought by
Coyle Susan M and Coyle Anne B
Create a Home Valuation Report for This Property
The Home Valuation Report is an in-depth analysis detailing your home's value as well as a comparison with similar homes in the area
Home Values in the Area
Average Home Value in this Area
Purchase History
| Date | Buyer | Sale Price | Title Company |
|---|---|---|---|
| Pfeil Deborah A | $160,000 | -- | |
| Coyle Susan M | $80,000 | -- |
Source: Public Records
Mortgage History
| Date | Status | Borrower | Loan Amount |
|---|---|---|---|
| Open | Coyle Susan M | $190,000 | |
| Closed | Coyle Susan M | $15,000 | |
| Closed | Coyle Susan M | $20,000 | |
| Closed | Coyle Susan M | $175,000 |
Source: Public Records
Tax History
| Year | Tax Paid | Tax Assessment Tax Assessment Total Assessment is a certain percentage of the fair market value that is determined by local assessors to be the total taxable value of land and additions on the property. | Land | Improvement |
|---|---|---|---|---|
| 2025 | $3,498 | $266,000 | $128,100 | $137,900 |
| 2024 | $3,282 | $266,000 | $128,100 | $137,900 |
| 2023 | $3,347 | $197,600 | $86,100 | $111,500 |
| 2022 | $3,276 | $197,600 | $86,100 | $111,500 |
| 2021 | $3,276 | $197,600 | $86,100 | $111,500 |
| 2020 | $3,096 | $148,200 | $71,200 | $77,000 |
| 2019 | $3,096 | $148,200 | $71,200 | $77,000 |
| 2018 | $2,983 | $148,200 | $71,200 | $77,000 |
| 2017 | $2,885 | $127,000 | $64,900 | $62,100 |
| 2016 | $2,780 | $127,000 | $64,900 | $62,100 |
| 2015 | $2,780 | $127,000 | $64,900 | $62,100 |
| 2014 | $2,689 | $116,600 | $61,900 | $54,700 |
Source: Public Records
Map
Nearby Homes
Your Personal Tour Guide
Ask me questions while you tour the home.