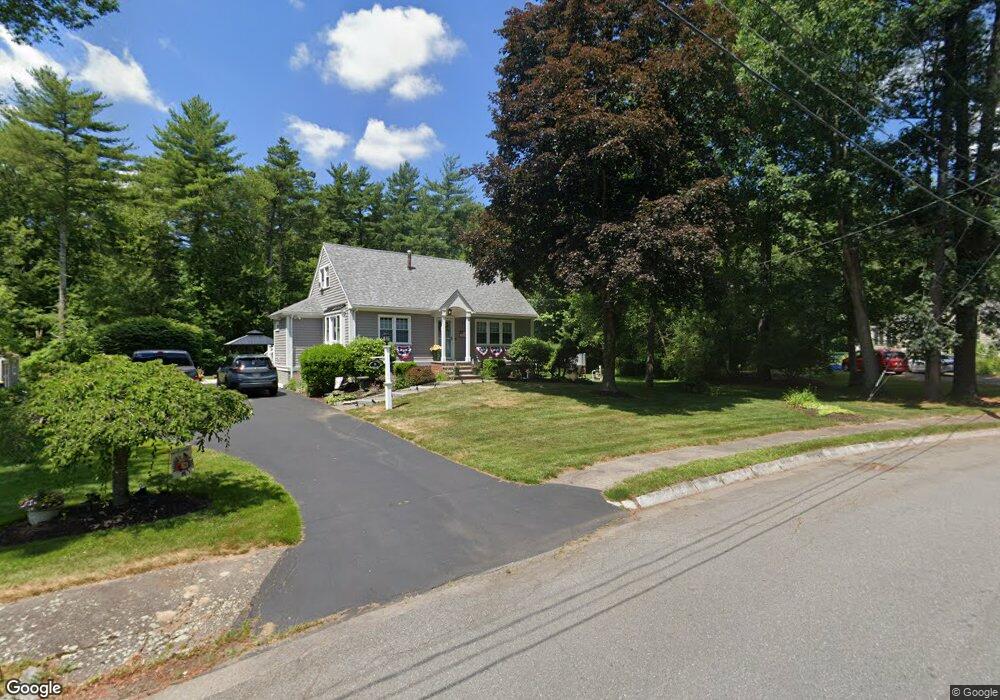
91 Branch Rd East Bridgewater, MA 02333
Estimated Value: $468,000 - $659,000
3
Beds
2
Baths
1,458
Sq Ft
$407/Sq Ft
Est. Value
About This Home
This home is located at 91 Branch Rd, East Bridgewater, MA 02333 and is currently estimated at $594,035, approximately $407 per square foot. 91 Branch Rd is a home located in Plymouth County with nearby schools including Central Elementary School, Gordon W Mitchell Middle School, and East Bridgewater Jr./Sr. High School.
Ownership History
Date
Name
Owned For
Owner Type
Purchase Details
Closed on
Aug 20, 1999
Sold by
Mortimer William J and Mortimer Teresa L
Bought by
Monahan Joseph J and Monahan Janice A
Current Estimated Value
Purchase Details
Closed on
Jul 30, 1993
Sold by
Derrico Michael A
Bought by
Mortimer William J and Mortimer Teresa L
Create a Home Valuation Report for This Property
The Home Valuation Report is an in-depth analysis detailing your home's value as well as a comparison with similar homes in the area
Home Values in the Area
Average Home Value in this Area
Purchase History
| Date | Buyer | Sale Price | Title Company |
|---|---|---|---|
| Monahan Joseph J | $199,000 | -- | |
| Mortimer William J | $136,000 | -- |
Source: Public Records
Mortgage History
| Date | Status | Borrower | Loan Amount |
|---|---|---|---|
| Open | Mortimer William J | $85,800 | |
| Open | Mortimer William J | $155,000 | |
| Closed | Mortimer William J | $11,000 |
Source: Public Records
Tax History Compared to Growth
Tax History
| Year | Tax Paid | Tax Assessment Tax Assessment Total Assessment is a certain percentage of the fair market value that is determined by local assessors to be the total taxable value of land and additions on the property. | Land | Improvement |
|---|---|---|---|---|
| 2025 | $7,132 | $521,700 | $231,900 | $289,800 |
| 2024 | $6,945 | $501,800 | $223,000 | $278,800 |
| 2023 | $6,897 | $477,300 | $223,000 | $254,300 |
| 2022 | $6,185 | $396,500 | $185,900 | $210,600 |
| 2021 | $1,528 | $354,400 | $178,600 | $175,800 |
| 2020 | $6,676 | $337,900 | $171,800 | $166,100 |
| 2019 | $6,534 | $324,600 | $164,200 | $160,400 |
| 2018 | $5,487 | $305,500 | $164,200 | $141,300 |
| 2017 | $5,808 | $291,300 | $156,600 | $134,700 |
| 2016 | $5,196 | $286,100 | $156,600 | $129,500 |
| 2015 | $5,015 | $282,400 | $155,500 | $126,900 |
| 2014 | $4,813 | $277,100 | $152,200 | $124,900 |
Source: Public Records
Map
Nearby Homes
- 1247 Central St
- 936 Central St
- 844 Washington St
- 5 Della Way
- 1 Simmons Place
- 182 Crystal Water Dr Unit 182
- 9 Daisy Ln
- 217 Crystal Water Dr
- 28 Brookbend Way E
- 78 Crystal Water Dr
- 51 Stonegate Dr
- 170 Elm St
- 587 Bridge St
- 1993 Washington St
- 71 Stonegate Dr
- 26 Meadowbrook Dr
- 2045 Washington St
- 14 Mountain Ash Rd
- 94 Pond St
- 22 Hudson St