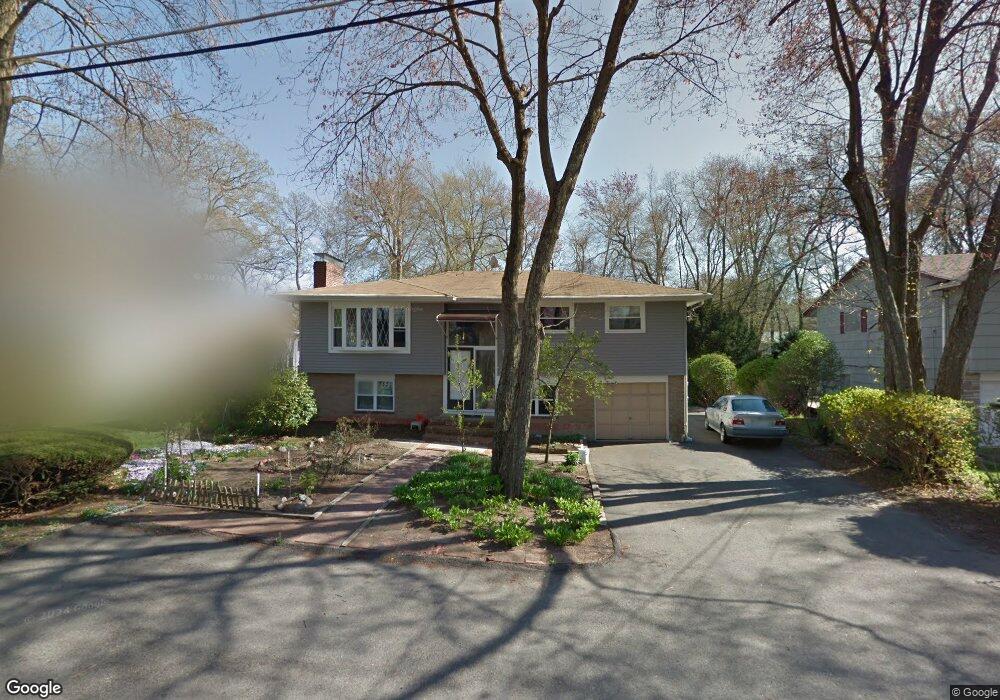
91 Breer Cir Brockton, MA 02301
Clifton Heights NeighborhoodEstimated Value: $492,000 - $644,000
3
Beds
3
Baths
1,781
Sq Ft
$321/Sq Ft
Est. Value
About This Home
This home is located at 91 Breer Cir, Brockton, MA 02301 and is currently estimated at $571,571, approximately $320 per square foot. 91 Breer Cir is a home located in Plymouth County with nearby schools including Gilmore Elementary School, John F. Kennedy Elementary School, and Davis K-8 School.
Ownership History
Date
Name
Owned For
Owner Type
Purchase Details
Closed on
Jan 30, 2001
Sold by
Grosser Morton D and Grosser Jacqueline S
Bought by
Giang Dau
Current Estimated Value
Home Financials for this Owner
Home Financials are based on the most recent Mortgage that was taken out on this home.
Original Mortgage
$160,000
Interest Rate
7.39%
Mortgage Type
Purchase Money Mortgage
Create a Home Valuation Report for This Property
The Home Valuation Report is an in-depth analysis detailing your home's value as well as a comparison with similar homes in the area
Home Values in the Area
Average Home Value in this Area
Purchase History
| Date | Buyer | Sale Price | Title Company |
|---|---|---|---|
| Giang Dau | $205,000 | -- |
Source: Public Records
Mortgage History
| Date | Status | Borrower | Loan Amount |
|---|---|---|---|
| Open | Giang Dau | $160,000 | |
| Closed | Giang Dau | $160,000 |
Source: Public Records
Tax History Compared to Growth
Tax History
| Year | Tax Paid | Tax Assessment Tax Assessment Total Assessment is a certain percentage of the fair market value that is determined by local assessors to be the total taxable value of land and additions on the property. | Land | Improvement |
|---|---|---|---|---|
| 2025 | $6,177 | $510,100 | $148,300 | $361,800 |
| 2024 | $6,074 | $505,300 | $148,300 | $357,000 |
| 2023 | $5,461 | $420,700 | $113,500 | $307,200 |
| 2022 | $5,506 | $394,100 | $103,300 | $290,800 |
| 2021 | $5,139 | $354,400 | $97,100 | $257,300 |
| 2020 | $4,620 | $336,800 | $93,000 | $243,800 |
| 2019 | $4,274 | $338,700 | $87,200 | $251,500 |
| 2018 | $4,852 | $302,100 | $87,200 | $214,900 |
| 2017 | $4,186 | $260,000 | $87,200 | $172,800 |
| 2016 | $4,425 | $254,900 | $83,300 | $171,600 |
| 2015 | $4,200 | $231,400 | $83,300 | $148,100 |
| 2014 | $4,395 | $242,400 | $83,300 | $159,100 |
Source: Public Records
Map
Nearby Homes