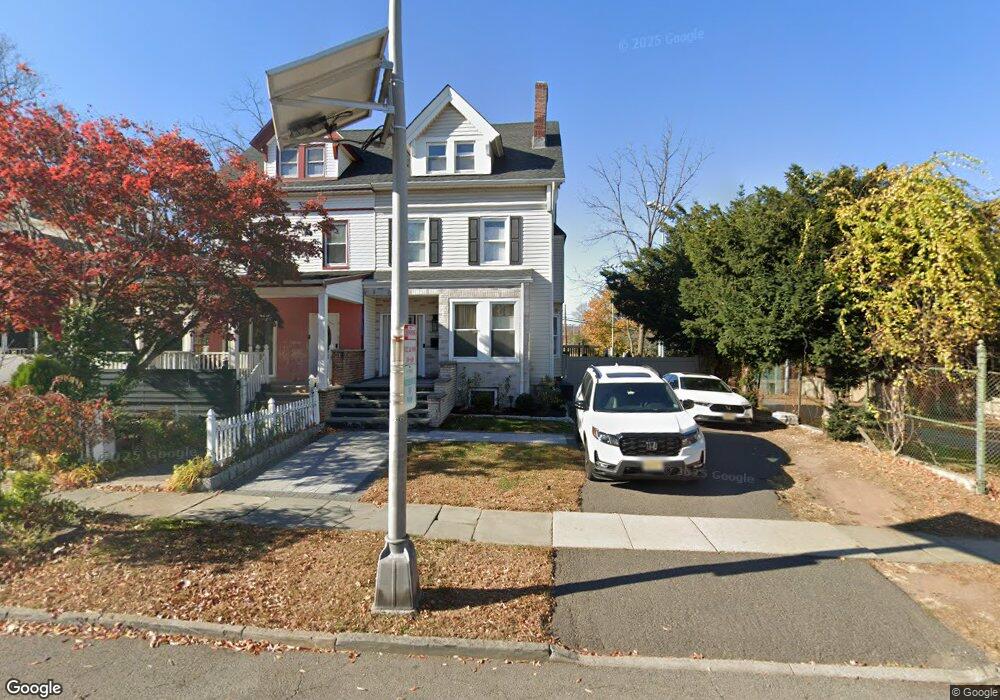
91 Brighton Ave East Orange, NJ 07017
Estimated Value: $497,589 - $619,000
--
Bed
--
Bath
2,091
Sq Ft
$264/Sq Ft
Est. Value
About This Home
This home is located at 91 Brighton Ave, East Orange, NJ 07017 and is currently estimated at $552,147, approximately $264 per square foot. 91 Brighton Ave is a home located in Essex County with nearby schools including Johnnie L. Cochran Junior Academy Elementary School, John L Costley Middle School, and Patrick F Healy Middle School.
Ownership History
Date
Name
Owned For
Owner Type
Purchase Details
Closed on
Oct 14, 2016
Sold by
Foster Adele J and Foster Adele J
Bought by
Price Cameo
Current Estimated Value
Purchase Details
Closed on
Mar 27, 1991
Sold by
Foster Greebe
Bought by
Foster Foster G and Foster A
Purchase Details
Closed on
Jun 13, 1990
Sold by
Horn Violet
Bought by
Foster Greba
Create a Home Valuation Report for This Property
The Home Valuation Report is an in-depth analysis detailing your home's value as well as a comparison with similar homes in the area
Home Values in the Area
Average Home Value in this Area
Purchase History
| Date | Buyer | Sale Price | Title Company |
|---|---|---|---|
| Price Cameo | $70,000 | None Available | |
| Foster Foster G | -- | -- | |
| Foster Greeba | -- | -- | |
| Foster Greba | $93,000 | -- |
Source: Public Records
Tax History Compared to Growth
Tax History
| Year | Tax Paid | Tax Assessment Tax Assessment Total Assessment is a certain percentage of the fair market value that is determined by local assessors to be the total taxable value of land and additions on the property. | Land | Improvement |
|---|---|---|---|---|
| 2025 | $11,443 | $361,200 | $97,000 | $264,200 |
| 2024 | $11,443 | $361,200 | $97,000 | $264,200 |
| 2022 | $10,496 | $361,200 | $97,000 | $264,200 |
| 2021 | $8,217 | $148,300 | $60,000 | $88,300 |
| 2020 | $8,112 | $148,300 | $60,000 | $88,300 |
| 2019 | $8,008 | $148,300 | $60,000 | $88,300 |
| 2018 | $7,909 | $148,300 | $60,000 | $88,300 |
| 2017 | $7,688 | $148,300 | $60,000 | $88,300 |
| 2016 | $7,568 | $148,300 | $60,000 | $88,300 |
| 2015 | $7,382 | $148,300 | $60,000 | $88,300 |
| 2014 | $7,279 | $148,300 | $60,000 | $88,300 |
Source: Public Records
Map
Nearby Homes
- 54 Linwood Place
- 153 Midland Ave
- 17 Cottage Place
- 172 Brighton Ave
- 608 Springdale Ave
- 33 Crescent Rd
- 105 Burchard Ave
- 10 Charles St
- 323 Glenwood Ave
- 323 Glenwood Ave Unit 4
- 207 Brighton Ave
- 206 Dodd St
- 77-79 Franklin St
- 293 N Center St
- 74 Long St Unit 76
- 73 Fulton St
- 289 N Center St
- 76 Long St
- 65 Washington St
- 253 Midland Ave
- 91 Brighton Ave Unit 1
- 89 Brighton Ave
- 85 Brighton Ave
- 99 Brighton Ave
- 83 Brighton Ave
- 101 Brighton Ave
- 81 Brighton Ave
- 64 Everett St
- 77 Brighton Ave
- 107 Brighton Ave
- 88 Brighton Ave
- 84 Brighton Ave
- 60 Everett St
- 82 Brighton Ave
- 73 Brighton Ave
- 106 Brighton Ave
- 78 Brighton Ave
- 76 Brighton Ave
- 76 Brighton Ave Unit 1
- 56 Everett St