
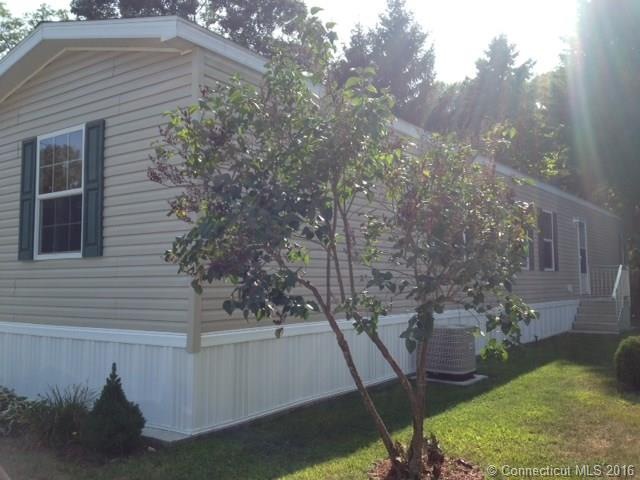
91 Buddington Rd Groton, CT 06340
Long Hill Neighborhood
2
Beds
2
Baths
924
Sq Ft
436
Sq Ft Lot
Highlights
- Property is near public transit
- Thermal Windows
- Shed
- Partially Wooded Lot
- Public Transportation
- Central Air
About This Home
As of December 2016Built in 2012 this Terrific Mobile Home has a Light, Bright & Open Floor Plan. Built to current building codes this home has 2 Bedrooms & 2 Full Bathrooms, Central Air, High Efficiency Propane Heat, Plenty of Kitchen Counter Space & a Full Sized Laundry Room. Great Location in this conveniently located neighborhood!!!
Last Agent to Sell the Property
William Raveis Real Estate License #REB.0754903 Listed on: 03/23/2016
Property Details
Home Type
- Mobile/Manufactured
Est. Annual Taxes
- $726
Year Built
- Built in 2012
Lot Details
- 436 Sq Ft Lot
- Level Lot
- Partially Wooded Lot
HOA Fees
- $475 Monthly HOA Fees
Parking
- Driveway
Home Design
- Vinyl Siding
Interior Spaces
- 924 Sq Ft Home
- Thermal Windows
- Crawl Space
Kitchen
- Oven or Range
- Electric Range
- Range Hood
- Dishwasher
Bedrooms and Bathrooms
- 2 Bedrooms
- 2 Full Bathrooms
Outdoor Features
- Shed
Location
- Property is near public transit
- Property is near a bus stop
Schools
- Pboe Elementary And Middle School
- Fitch Senior High School
Utilities
- Central Air
- Heating System Uses Oil Above Ground
- Heating System Uses Propane
- Propane Water Heater
- Cable TV Available
Community Details
Overview
- Association fees include insurance, snow removal, trash pickup, water
- Briarcliff Subdivision
Amenities
- Public Transportation
Ownership History
Date
Name
Owned For
Owner Type
Purchase Details
Closed on
Jul 19, 2011
Sold by
Highrock Corp
Bought by
Rowsam W Rowsakathleen
Home Financials for this Owner
Home Financials are based on the most recent Mortgage that was taken out on this home.
Original Mortgage
$40,000
Interest Rate
4.58%
Mortgage Type
Commercial
Purchase Details
Closed on
Dec 20, 2010
Sold by
Dwire Ethelyn H
Bought by
High Rock Mobile Home
Purchase Details
Closed on
Nov 29, 2010
Sold by
High Rock Corp
Bought by
Jullarine Patricia J
Purchase Details
Closed on
Nov 16, 2010
Sold by
Villano Ambrose and Villano Rose
Bought by
Spicer Charles J and Spicer Barbara A
Purchase Details
Closed on
Jun 11, 2010
Sold by
Breed Laura M
Bought by
High Rock Corp
Purchase Details
Closed on
Mar 26, 2010
Sold by
Ackley Calvin A and Ackley Dawn W
Bought by
Briarcliff Lrty Llc
Purchase Details
Closed on
Nov 16, 2009
Sold by
Dwire Olin L
Bought by
Dwire Ethelyn H
Purchase Details
Closed on
May 26, 2009
Sold by
Wilson Jessica L
Bought by
Fouse Pattiann
Similar Homes in the area
Create a Home Valuation Report for This Property
The Home Valuation Report is an in-depth analysis detailing your home's value as well as a comparison with similar homes in the area
Home Values in the Area
Average Home Value in this Area
Purchase History
| Date | Type | Sale Price | Title Company |
|---|---|---|---|
| Deed | $44,000 | -- | |
| Deed | -- | -- | |
| Deed | -- | -- | |
| Deed | -- | -- | |
| Deed | $63,000 | -- | |
| Deed | $10,000 | -- | |
| Warranty Deed | -- | -- | |
| Deed | -- | -- | |
| Deed | $50,000 | -- |
Source: Public Records
Mortgage History
| Date | Status | Loan Amount | Loan Type |
|---|---|---|---|
| Closed | $40,000 | Commercial | |
| Previous Owner | $30,000 | Commercial |
Source: Public Records
Property History
| Date | Event | Price | Change | Sq Ft Price |
|---|---|---|---|---|
| 12/27/2016 12/27/16 | Sold | $39,000 | -6.0% | $42 / Sq Ft |
| 11/15/2016 11/15/16 | Pending | -- | -- | -- |
| 10/17/2016 10/17/16 | Price Changed | $41,500 | -3.5% | $45 / Sq Ft |
| 09/28/2016 09/28/16 | Price Changed | $43,000 | -7.5% | $47 / Sq Ft |
| 09/04/2016 09/04/16 | Price Changed | $46,500 | +232.1% | $50 / Sq Ft |
| 07/27/2016 07/27/16 | Sold | $14,000 | -70.5% | $19 / Sq Ft |
| 07/01/2016 07/01/16 | Sold | $47,500 | -4.8% | $41 / Sq Ft |
| 07/01/2016 07/01/16 | For Sale | $49,900 | 0.0% | $54 / Sq Ft |
| 06/10/2016 06/10/16 | Pending | -- | -- | -- |
| 05/16/2016 05/16/16 | For Sale | $49,900 | +232.7% | $43 / Sq Ft |
| 05/01/2016 05/01/16 | Pending | -- | -- | -- |
| 04/21/2016 04/21/16 | For Sale | $15,000 | -73.2% | $21 / Sq Ft |
| 04/05/2016 04/05/16 | Sold | $56,000 | +34.9% | $37 / Sq Ft |
| 03/23/2016 03/23/16 | Sold | $41,500 | -7.6% | $45 / Sq Ft |
| 03/23/2016 03/23/16 | Pending | -- | -- | -- |
| 03/23/2016 03/23/16 | For Sale | $44,900 | -4.5% | $49 / Sq Ft |
| 03/06/2016 03/06/16 | Pending | -- | -- | -- |
| 12/24/2015 12/24/15 | Sold | $47,000 | -21.5% | $28 / Sq Ft |
| 11/18/2015 11/18/15 | For Sale | $59,900 | +14.1% | $40 / Sq Ft |
| 10/16/2015 10/16/15 | Sold | $52,500 | +191.7% | $35 / Sq Ft |
| 10/16/2015 10/16/15 | Sold | $18,000 | -64.0% | $17 / Sq Ft |
| 10/09/2015 10/09/15 | Pending | -- | -- | -- |
| 09/24/2015 09/24/15 | Pending | -- | -- | -- |
| 09/13/2015 09/13/15 | Pending | -- | -- | -- |
| 09/05/2015 09/05/15 | For Sale | $50,000 | +67.2% | $30 / Sq Ft |
| 07/24/2015 07/24/15 | For Sale | $29,900 | +99.3% | $28 / Sq Ft |
| 07/13/2015 07/13/15 | Sold | $15,000 | -80.0% | $14 / Sq Ft |
| 06/22/2015 06/22/15 | Pending | -- | -- | -- |
| 06/04/2015 06/04/15 | For Sale | $74,900 | +205.7% | $50 / Sq Ft |
| 05/06/2015 05/06/15 | For Sale | $24,500 | -31.9% | $22 / Sq Ft |
| 12/01/2014 12/01/14 | Sold | $36,000 | -7.7% | $33 / Sq Ft |
| 11/07/2014 11/07/14 | Pending | -- | -- | -- |
| 09/22/2014 09/22/14 | For Sale | $39,000 | +63.2% | $35 / Sq Ft |
| 09/03/2014 09/03/14 | Sold | $23,900 | +91.2% | $26 / Sq Ft |
| 08/26/2014 08/26/14 | Pending | -- | -- | -- |
| 08/20/2014 08/20/14 | Sold | $12,500 | -47.7% | $15 / Sq Ft |
| 08/20/2014 08/20/14 | For Sale | $23,900 | +127.6% | $26 / Sq Ft |
| 08/01/2014 08/01/14 | Pending | -- | -- | -- |
| 07/05/2014 07/05/14 | For Sale | $10,500 | -79.6% | $13 / Sq Ft |
| 01/24/2014 01/24/14 | Sold | $51,500 | -11.2% | $41 / Sq Ft |
| 01/13/2014 01/13/14 | Pending | -- | -- | -- |
| 12/30/2013 12/30/13 | For Sale | $58,000 | -12.1% | $46 / Sq Ft |
| 06/05/2013 06/05/13 | Sold | $66,000 | -8.3% | $47 / Sq Ft |
| 03/05/2013 03/05/13 | Pending | -- | -- | -- |
| 01/15/2013 01/15/13 | For Sale | $72,000 | +95.1% | $51 / Sq Ft |
| 10/26/2012 10/26/12 | Sold | $36,900 | -5.1% | $40 / Sq Ft |
| 10/02/2012 10/02/12 | Pending | -- | -- | -- |
| 09/09/2012 09/09/12 | For Sale | $38,900 | +76.8% | $42 / Sq Ft |
| 08/31/2012 08/31/12 | Sold | $22,000 | -33.1% | $20 / Sq Ft |
| 08/06/2012 08/06/12 | Pending | -- | -- | -- |
| 06/26/2012 06/26/12 | For Sale | $32,900 | +31.6% | $30 / Sq Ft |
| 01/31/2012 01/31/12 | Sold | $25,000 | +42.9% | $21 / Sq Ft |
| 01/27/2012 01/27/12 | Sold | $17,500 | -27.1% | $23 / Sq Ft |
| 01/10/2012 01/10/12 | Pending | -- | -- | -- |
| 01/06/2012 01/06/12 | Pending | -- | -- | -- |
| 11/20/2011 11/20/11 | For Sale | $24,000 | -51.5% | $32 / Sq Ft |
| 04/25/2011 04/25/11 | For Sale | $49,500 | -- | $41 / Sq Ft |
Source: SmartMLS
Tax History Compared to Growth
Tax History
| Year | Tax Paid | Tax Assessment Tax Assessment Total Assessment is a certain percentage of the fair market value that is determined by local assessors to be the total taxable value of land and additions on the property. | Land | Improvement |
|---|---|---|---|---|
| 2025 | $47,393 | $1,606,010 | $1,361,598 | $244,412 |
| 2024 | $44,615 | $1,606,010 | $1,361,598 | $244,412 |
| 2023 | $43,732 | $1,606,010 | $1,256,850 | $349,160 |
| 2022 | $42,720 | $1,606,010 | $1,256,850 | $349,160 |
| 2021 | $37,530 | $1,155,840 | $748,160 | $407,680 |
| 2020 | $36,548 | $1,155,840 | $748,160 | $407,680 |
| 2019 | $35,195 | $1,155,840 | $748,160 | $407,680 |
| 2018 | $34,837 | $1,155,840 | $748,160 | $407,680 |
| 2017 | $33,935 | $1,155,840 | $748,160 | $407,680 |
| 2016 | $30,622 | $1,090,530 | $706,230 | $384,300 |
| 2015 | $29,444 | $1,090,530 | $706,230 | $384,300 |
| 2014 | $28,659 | $1,090,530 | $706,230 | $384,300 |
Source: Public Records
Agents Affiliated with this Home
-
Bill Heenan
Seller's Agent in 2016
Bill Heenan
William Raveis Real Estate
(860) 850-2697
2 in this area
806 Total Sales
-
Bette Giesing
Seller's Agent in 2016
Bette Giesing
IMT Realty
(860) 912-3213
1 in this area
51 Total Sales
-
Joanne Kelley
Seller's Agent in 2016
Joanne Kelley
William Pitt
(860) 608-0641
18 Total Sales
-
D
Seller's Agent in 2016
David Patton
William Raveis Real Estate
-
Charene Clark
Buyer's Agent in 2016
Charene Clark
Coldwell Banker Realty
(860) 391-4321
1 in this area
92 Total Sales
-
Matt St. Amour
Buyer's Agent in 2016
Matt St. Amour
Making Connections Realty
(860) 803-4061
1 in this area
38 Total Sales
Map
Source: SmartMLS
MLS Number: E10119129
APN: GROT-001698-000638-003694
Disclaimer: Certain information contained herein is derived from information provided by parties other than Homes.com. All information provided is deemed reliable, but is not guaranteed to be accurate and should be independently verified.
![]() IDX information is provided exclusively for personal, non-commercial use, and may not be used for any purpose other than to identify prospective properties consumers may be interested in purchasing. Information is deemed reliable but not guaranteed.
IDX information is provided exclusively for personal, non-commercial use, and may not be used for any purpose other than to identify prospective properties consumers may be interested in purchasing. Information is deemed reliable but not guaranteed.
Nearby Homes