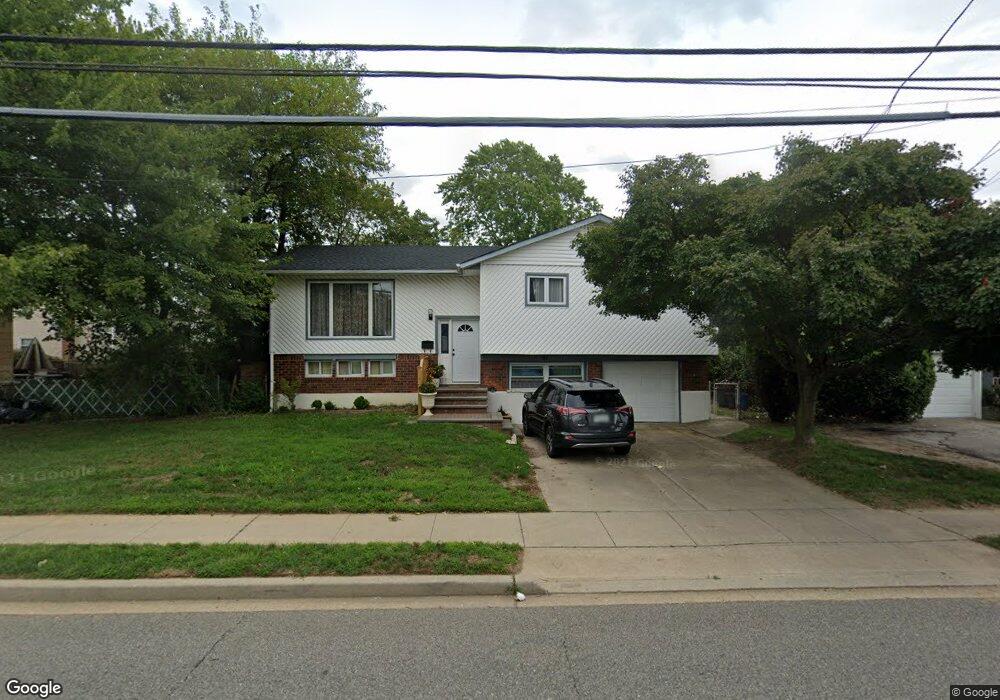
91 Carmans Rd Massapequa, NY 11758
Estimated Value: $705,000 - $741,963
4
Beds
2
Baths
2,000
Sq Ft
$362/Sq Ft
Est. Value
About This Home
This home is located at 91 Carmans Rd, Massapequa, NY 11758 and is currently estimated at $723,482, approximately $361 per square foot. 91 Carmans Rd is a home located in Nassau County with nearby schools including Northeast Elementary School, Northwest Elementary School, and Park Avenue Memorial Elementary School.
Ownership History
Date
Name
Owned For
Owner Type
Purchase Details
Closed on
Jun 21, 2019
Sold by
Ny Property I Llc
Bought by
Diez Jean J and Casal Roselande
Current Estimated Value
Home Financials for this Owner
Home Financials are based on the most recent Mortgage that was taken out on this home.
Original Mortgage
$407,483
Outstanding Balance
$361,935
Interest Rate
4.62%
Mortgage Type
FHA
Estimated Equity
$361,547
Purchase Details
Closed on
Aug 7, 2018
Sold by
Deutsche Bank National Trust Co
Bought by
Ny Property Holdings I Llc
Purchase Details
Closed on
Feb 6, 2018
Sold by
Saygili Ahmet and Covello Joseph
Bought by
Deutsche Bank National Trust Co
Create a Home Valuation Report for This Property
The Home Valuation Report is an in-depth analysis detailing your home's value as well as a comparison with similar homes in the area
Home Values in the Area
Average Home Value in this Area
Purchase History
| Date | Buyer | Sale Price | Title Company |
|---|---|---|---|
| Diez Jean J | $415,000 | None Available | |
| Diez Jean J | $415,000 | None Available | |
| Ny Property Holdings I Llc | $271,500 | None Available | |
| Ny Property Holdings I Llc | $271,500 | None Available | |
| Deutsche Bank National Trust Co | $654,000 | -- | |
| Deutsche Bank National Trust Co | $654,000 | -- |
Source: Public Records
Mortgage History
| Date | Status | Borrower | Loan Amount |
|---|---|---|---|
| Open | Diez Jean J | $407,483 | |
| Closed | Diez Jean J | $407,483 |
Source: Public Records
Tax History Compared to Growth
Tax History
| Year | Tax Paid | Tax Assessment Tax Assessment Total Assessment is a certain percentage of the fair market value that is determined by local assessors to be the total taxable value of land and additions on the property. | Land | Improvement |
|---|---|---|---|---|
| 2025 | $12,623 | $398 | $136 | $262 |
| 2024 | $3,350 | $398 | $136 | $262 |
| 2023 | $12,530 | $421 | $144 | $277 |
| 2022 | $12,530 | $398 | $136 | $262 |
| 2021 | $12,217 | $447 | $153 | $294 |
| 2020 | $18,576 | $765 | $407 | $358 |
| 2019 | $3,987 | $765 | $407 | $358 |
| 2018 | $8,635 | $765 | $0 | $0 |
| 2017 | $8,635 | $765 | $407 | $358 |
| 2016 | $12,253 | $765 | $407 | $358 |
| 2015 | $3,243 | $765 | $407 | $358 |
| 2014 | $3,243 | $765 | $407 | $358 |
| 2013 | $2,944 | $765 | $407 | $358 |
Source: Public Records
Map
Nearby Homes